These are the notes describing my experience setting up a basic interface to control and display IMU data with Electric UI and an ESP32.
Preparation & Installation
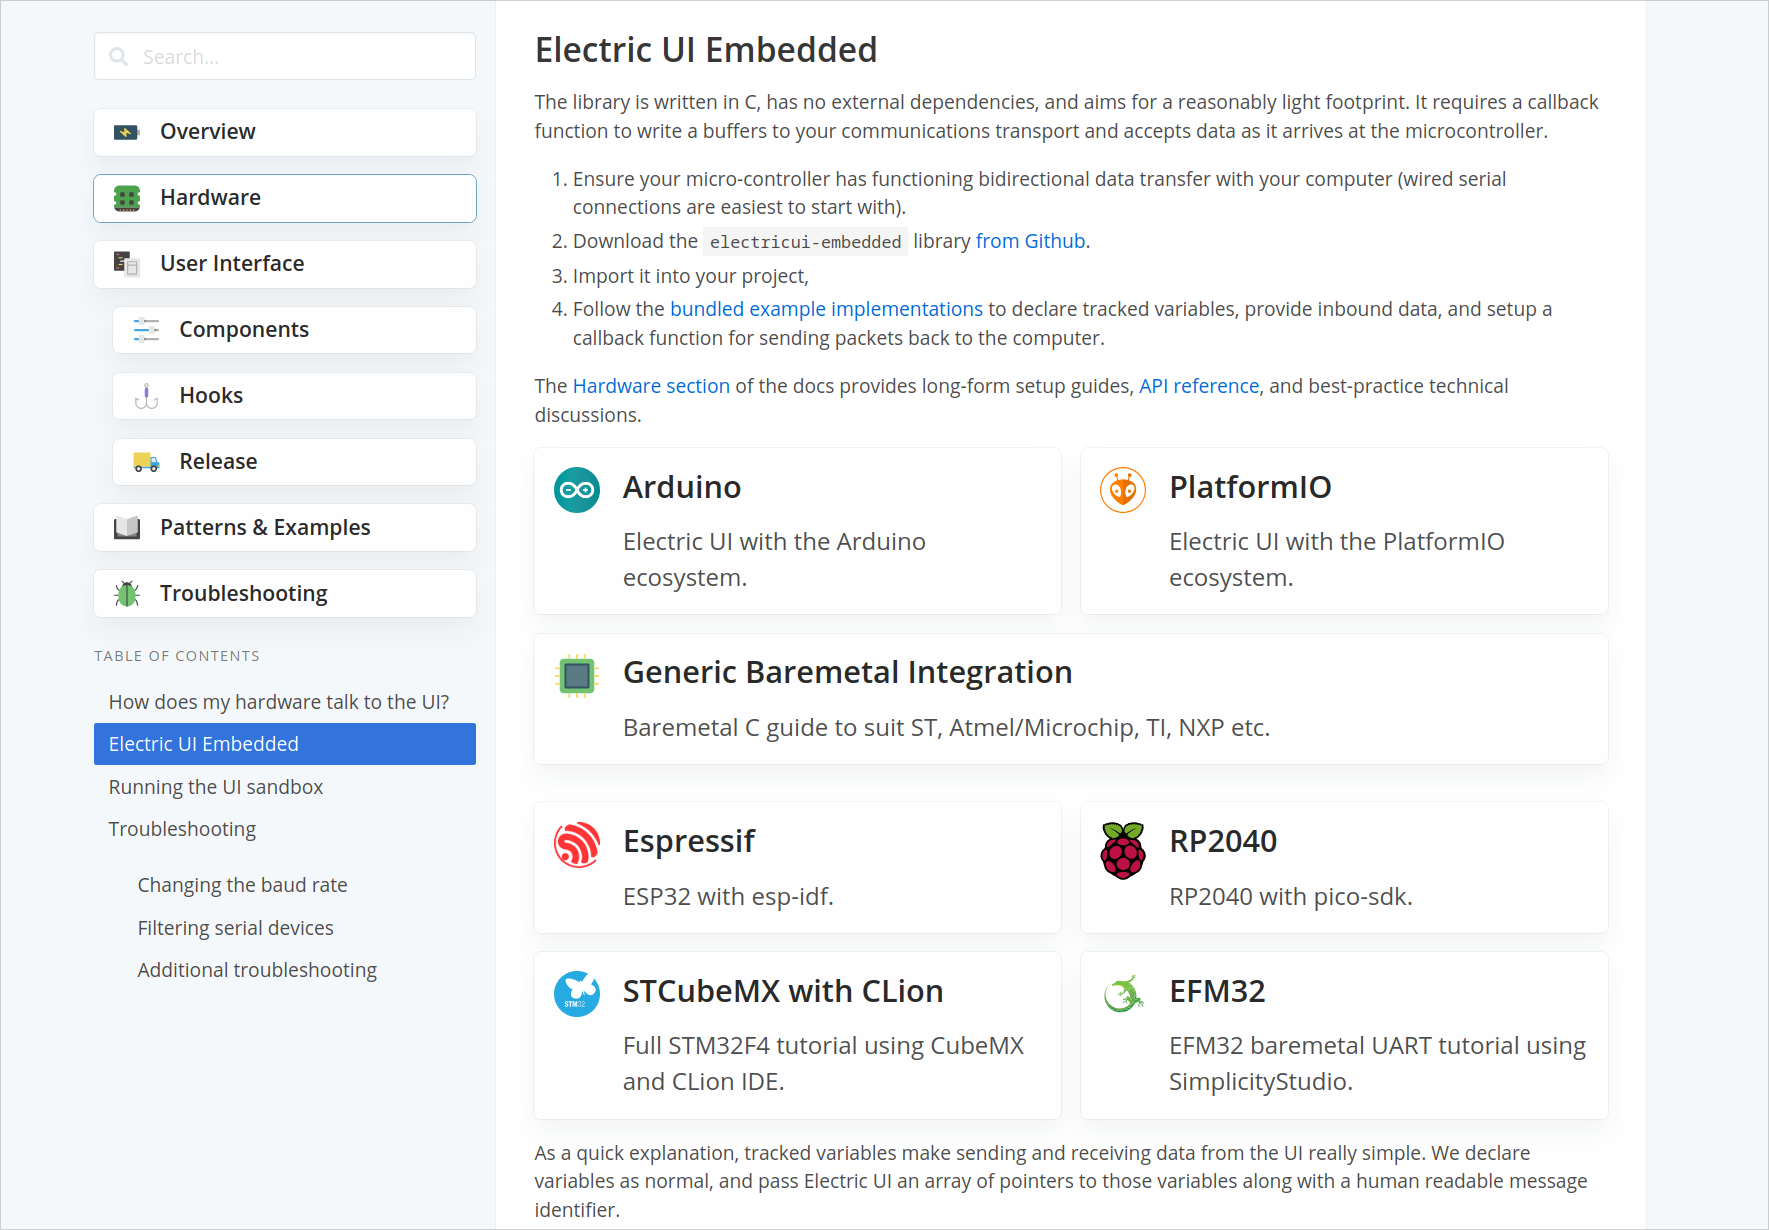
The official quickstart covers displaying and controlling a blinking LED pretty well. I won't repeat that specific process here, this covers my specific experience/thoughts on seeing how Electric UI meets common basic test requirements.
Software Install
Two pieces of software need to be installed:
- Electric UI's
arcCLI helper tool - NodeJS
An installer for Windows is provided, but I'm running Linux so I followed the install instructions:
curl -o- https://raw.githubusercontent.com/nvm-sh/nvm/v0.39.3/install.sh | bash
nvm install 18
corepack enable

curl https://install.electricui.com | bash
I read through their installer script, and it only seems to be a wrapper around finding the system architecture and OS, and then it downloads and uncompresses the binary before moving it into /usr/bin .
They also recommend using VSCode as the editor for the projects. I use it as my primary IDE already so I didn't need to install it. As far as I could tell, there's no requirement or specific plugins or tools.
Starting a UI project
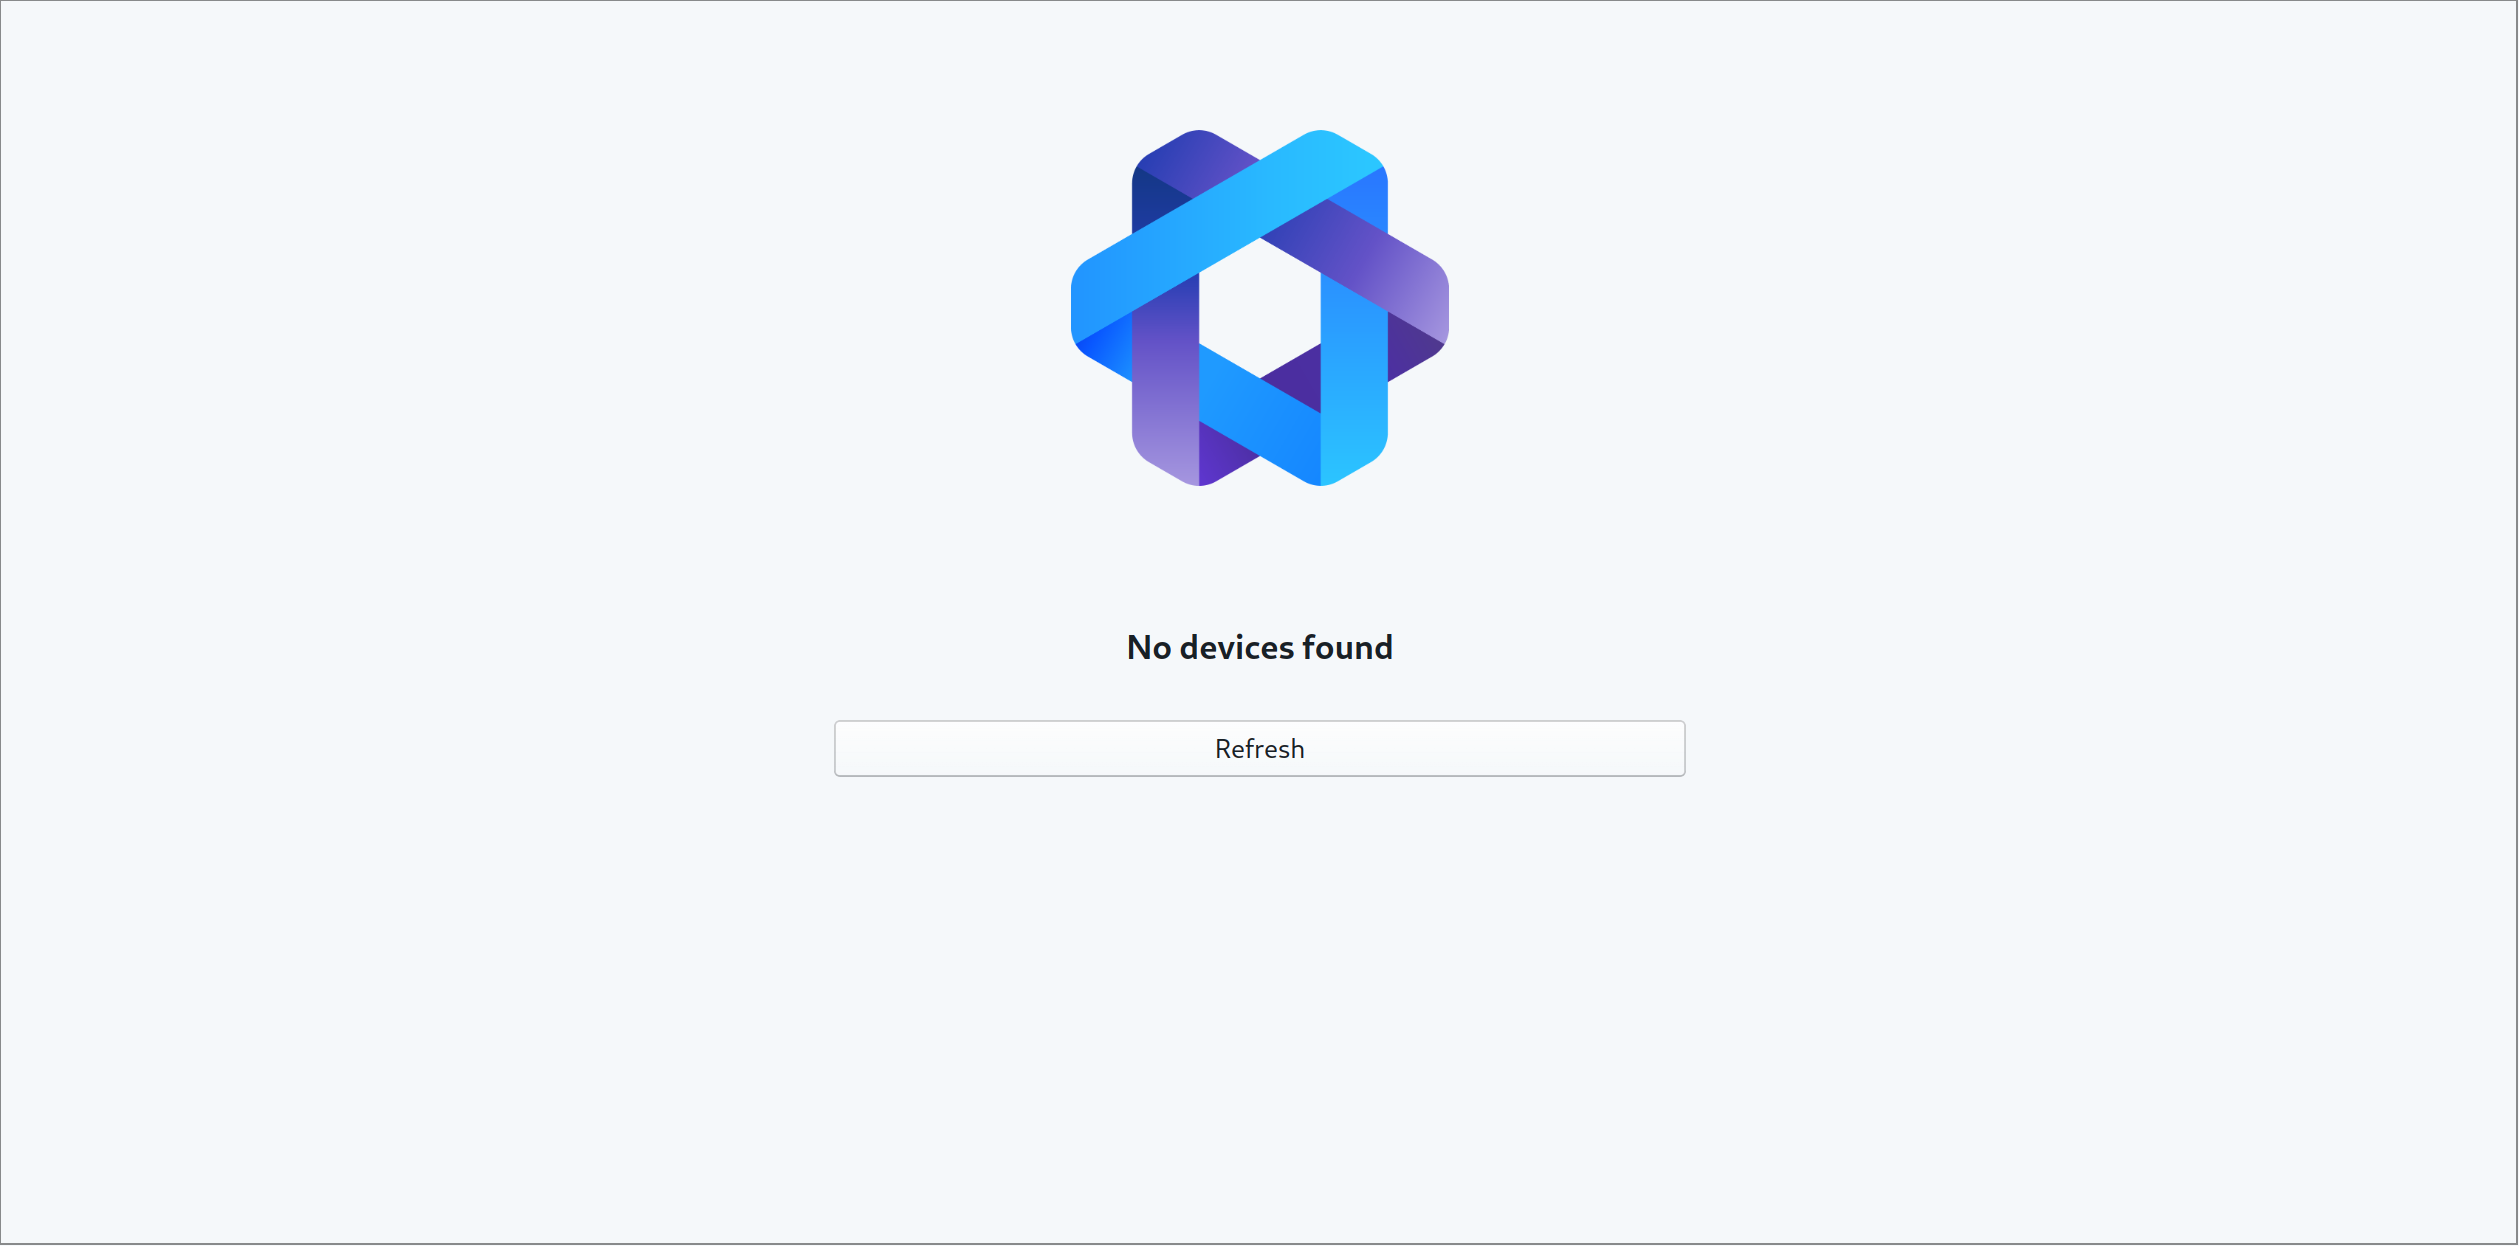
Following the docs, after logging in with my account I created a new project and then launched the dev environment.
arc init imu-test
cd imu-test
arc start
Firmware setup time...
Hardware
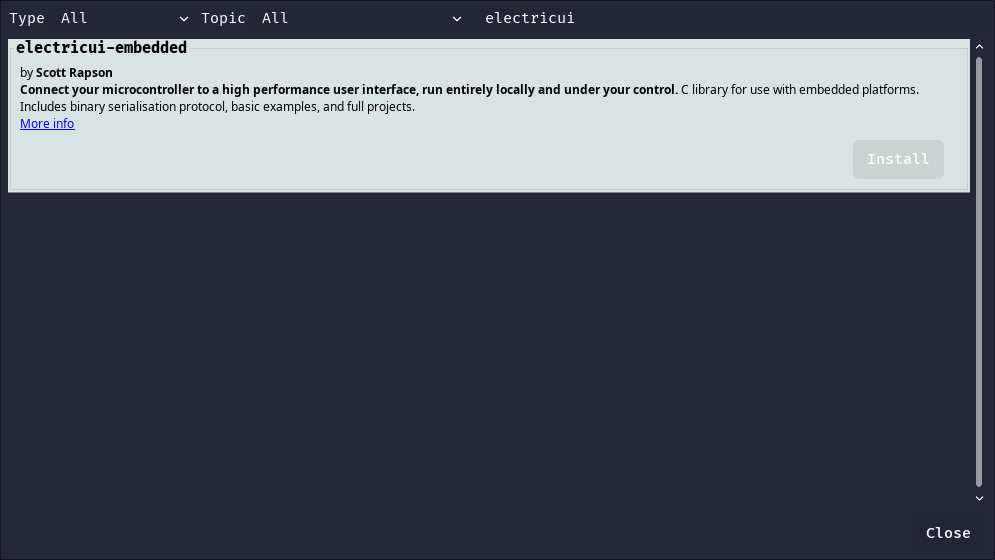
Installing the library was easy using the Arduino Library Manager.
Electric UI uses a concept called 'tracked variables' to describe the data being shared between the microcontroller and UI.
Unlike the other IOT style libraries I've used, it makes you declare your own variables and add them to a list with a macro. This means it's slightly more tedious to add and setup a variable, but doesn't seem to restrict the types of data being shared.
The firmware is similar to the their example hello-eui sketch, but I slightly modified it and added the IMU readings as tracked variables.
#include "electricui.h"

#include "SparkFunLSM6DSO.h"
#include "Wire.h"

LSM6DSO myIMU; //Default constructor is I2C, addr 0x6B

uint8_t led_on = 0;
uint16_t blink_ms = 250;
uint32_t led_timer = 0;

float accel_x = 0;
float accel_y = 0;
float accel_z = 0;

// Instantiate the communication interface's management object
eui_interface_t serial_comms = EUI_INTERFACE( &serial_write );

// Electric UI manages variables referenced in this array
eui_message_t tracked_variables[] =
{
  EUI_UINT8( "led", led_on ),
  EUI_UINT16( "blink_ms", blink_ms ),
  EUI_FLOAT_RO( "acc_x", accel_x ),
  EUI_FLOAT_RO( "acc_y", accel_y ),
  EUI_FLOAT_RO( "acc_z", accel_z ),
};

void setup()
{
  Serial.begin( 115200 );
  pinMode( LED_BUILTIN, OUTPUT );

  eui_setup_interface( &serial_comms );
  EUI_TRACK( tracked_variables );
  eui_setup_identifier( "hello", 5 );

  Wire.begin();
  myIMU.begin();
  myIMU.initialize(BASIC_SETTINGS);

  led_timer = millis();
}

void loop()
{
  while( Serial.available() > 0 )
  {
    eui_parse( Serial.read(), &serial_comms );
  }

  accel_x = myIMU.readFloatAccelX();
  accel_y = myIMU.readFloatAccelY();
  accel_z = myIMU.readFloatAccelZ();

  if( millis() - led_timer >= blink_ms )
  {
    led_on = !led_on; //invert led state
    led_timer = millis();
    digitalWrite( LED_BUILTIN, led_on);
  }

}

void serial_write( uint8_t *data, uint16_t len )
{
  Serial.write( data, len );
}
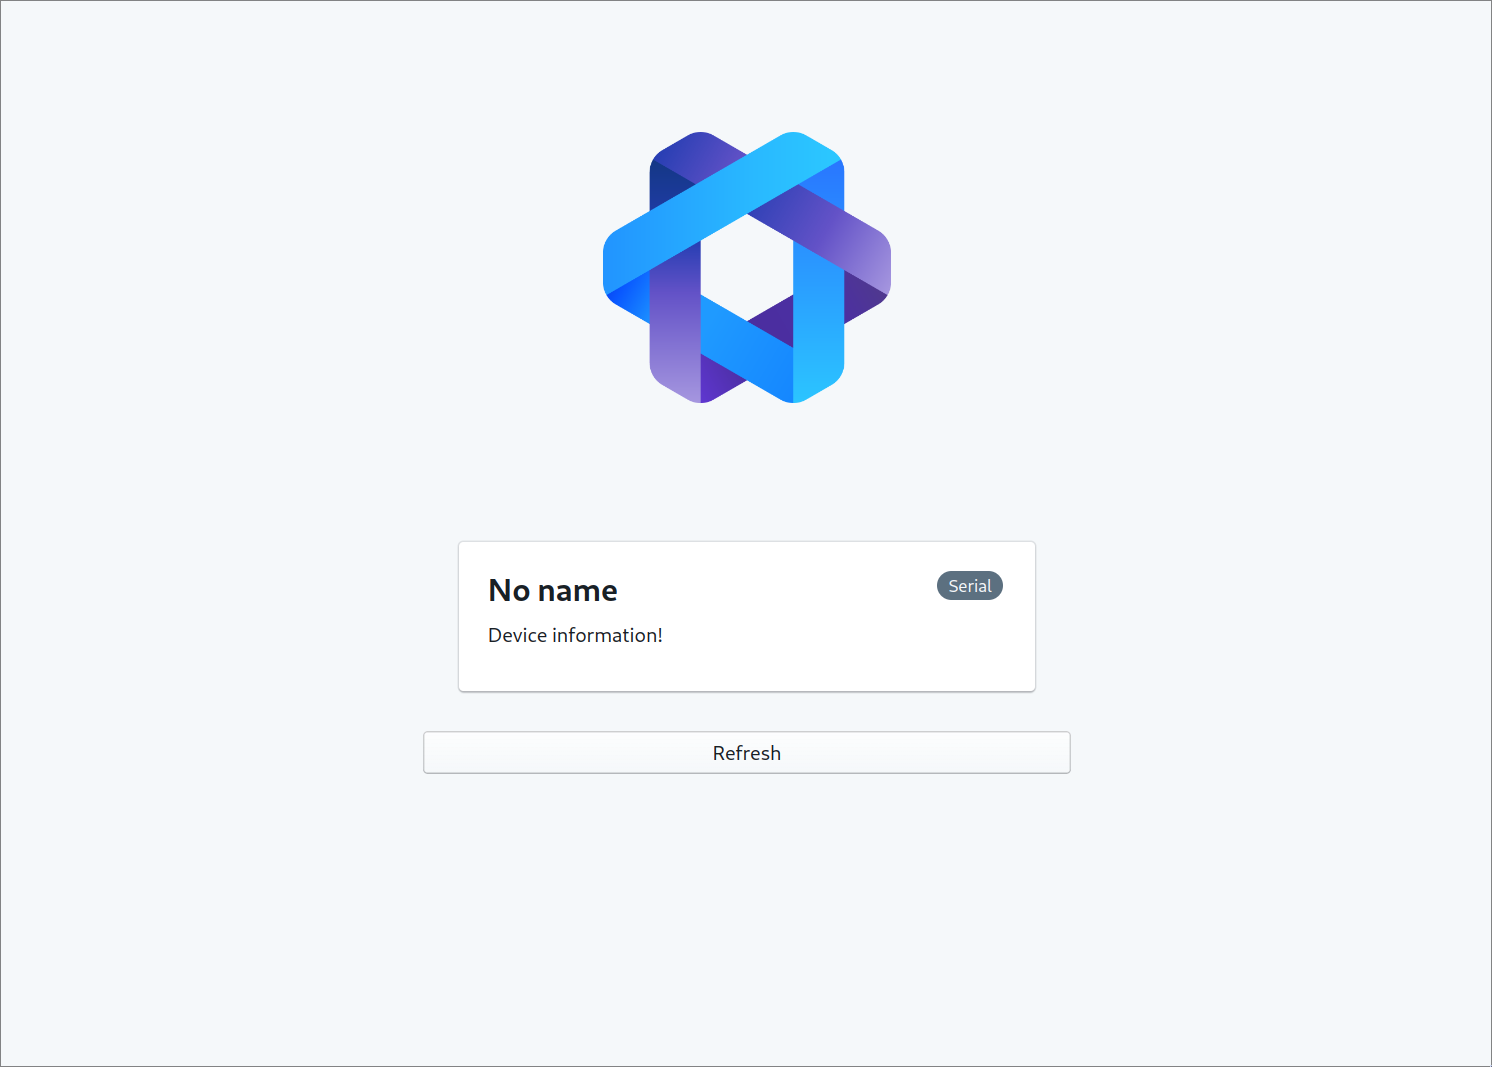
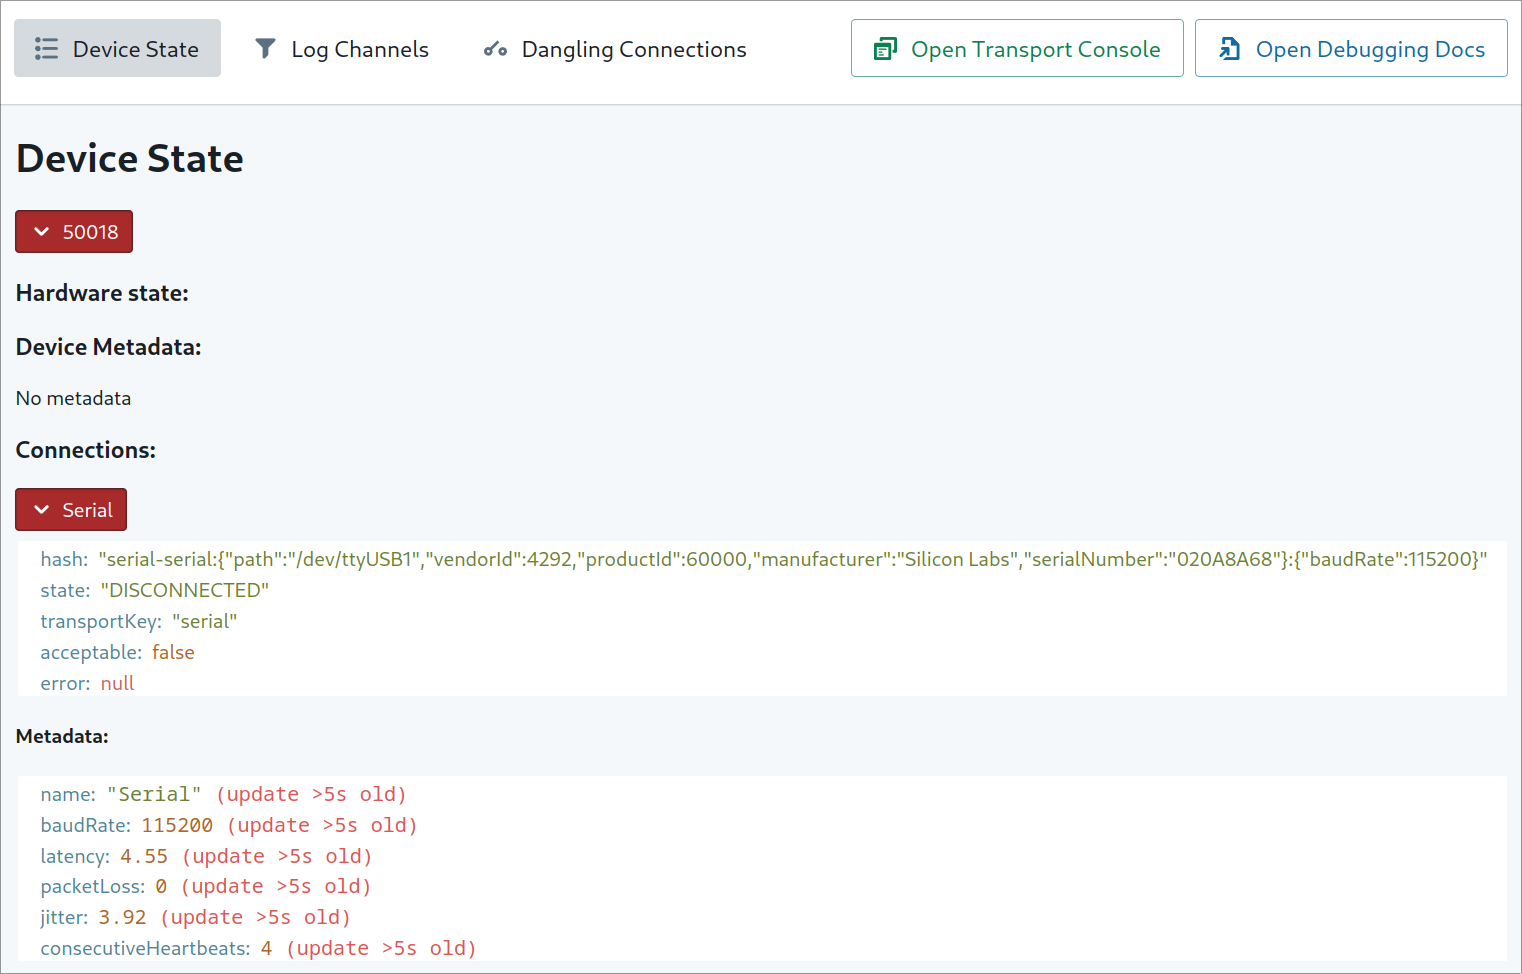
As soon as I flashed the ESP32, it appeared in the dev sandbox.
UI Layout
The template comes with a simple example layout which matches their quickstart guide. Bonus points for the cute cat which flicks it's tail when the LED blinks on and off...
The generated project structure was a bit overwhelming to start off. The quickstart flow explains it pretty well, but to summarise, the /src/ folder has subfolders called
application- the actual user-interfacetransport-manager- setup and configuration for hardware communications and handlingwindow-manager- setup and launches the application window
which basically do what you'd expect. The reasoning for this is apparently because the transport-manager is run as a separate process from the UI.
Digging into the source for the template's starting layout in /src/application/pages/DevicePages/OverviewPage.tsx we can see the default layout.
I changed the template to add new MessageDataSource for the x/y/z acceleration values, and changed the IntervalRequester entry to poll those tracked variables every 20ms. When I saved the saved the file in VSCode, the sandbox updated with the new chart and started streaming in the data.
const xIMUDataSource = new MessageDataSource('acc_x')
const yIMUDataSource = new MessageDataSource('acc_y')
const zIMUDataSource = new MessageDataSource('acc_z')

export const OverviewPage = (props: RouteComponentProps) => {
  return (
    <React.Fragment>
      <IntervalRequester interval={20} variables={['acc_x', 'acc_y', 'acc_z']} />

      <Composition areas={layoutDescription} gap={10} autoCols="1fr 2fr">
        {Areas => (
          <React.Fragment>
            <Areas.Chart>
              <Card>
                <div style={{ textAlign: 'center', marginBottom: '1em' }}>
                  <b>Accelerometer</b>
                </div>
                <ChartContainer height="45vh">
                  <LineChart dataSource={xIMUDataSource} color={Colors.GREEN5} />
                  <LineChart dataSource={yIMUDataSource} color={Colors.RED5} />
                  <LineChart dataSource={zIMUDataSource} color={Colors.BLUE5} />
                  <RealTimeDomain window={10000} />
                  <TimeAxis />
                  <VerticalAxis label='G-Force'/>
                </ChartContainer>
              </Card>
            </Areas.Chart>

// rest of layout...
I've since learnt that I should have used a struct with all 3 acceleration readings from hardware, and then I'd only need to use one datasource and poll one variable...
The documentation made it easy to understand how to set specific colors for each line and add the y-axis label.
I wanted to print the accelerations as text, and first used the Printer component. This worked well, but was just some small unformatted text.
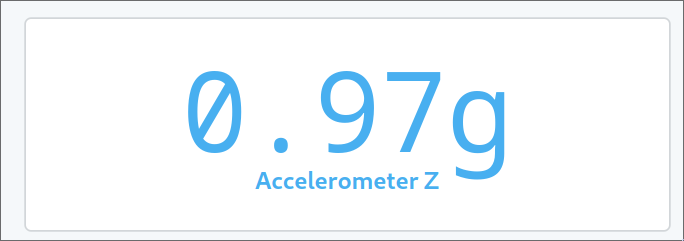
The Statistic component was a better choice, and I was able to style them with the same colors as the plotted lines. I just copied it straight out of the documentation.
<Statistic
    accessor="acc_x"
    label="Accelerometer X"
    color={Colors.GREEN5}
    suffix="g"
    precision={3}
/>
For layout, the template includes some kind of helper library that manages css grid. I'm used to using grid with raw CSS, but the quickstart guide included enough about changing the template's layout that it made sense pretty quickly.
I added some extra entries for the text outputs,
const layoutDescription = `
IMUX Chart
IMUY Chart
IMUZ Chart
. Slider
`
and then put the Statistic components in their named grids and the layout worked fine. I decided to wrap them with a Card component to make it look a bit prettier.
<Areas.IMUX>
  <Card>
    <Statistic
      accessor="acc_x"
      label="Accelerometer X"
      color={Colors.GREEN5}
      suffix="g"
      precision={3}
    />
  </Card>
</Areas.IMUX>
and the basic layout test is done.
Summary
The out of the box charting is the best feeling charting I've ever used, running perfectly at 144Hz with no jitter or performance drops.
I haven't worked out how to measure latency yet but I just spent a few minutes shaking the IMU around. The low-latency is hard to show through a recording...
The quickstart guide was pretty good, taking maybe 15 minutes to get running. Hardware integration was similar to most other tools I've tested so far, no complaints.
The biggest point of discussion is probably the amount of work it took to get the final interface shown in the screen recording.
I spent probably 20-30 minutes reading documentation and iterating with charting settings and layouts. In comparison, the basic test interfaces with some of the 'no-code' web builders were quicker to prototype with.
This isn't a bad thing though, investing in learning a more powerful tool (at least in this situation) returns much more control over layout/styling and behaviour of the UI, and it doesn't seem to have any artificial limits or paywalls that the web-dashboards are filled with.