This is the notes describing the process of getting a basic dashboard interface controlling a blinking LED and displaying IMU data using the Blynk cloud ecosystem, app, and an ESP32.
For a more comprehensive look at Blynk, read my product review here.
Preparation and Installation
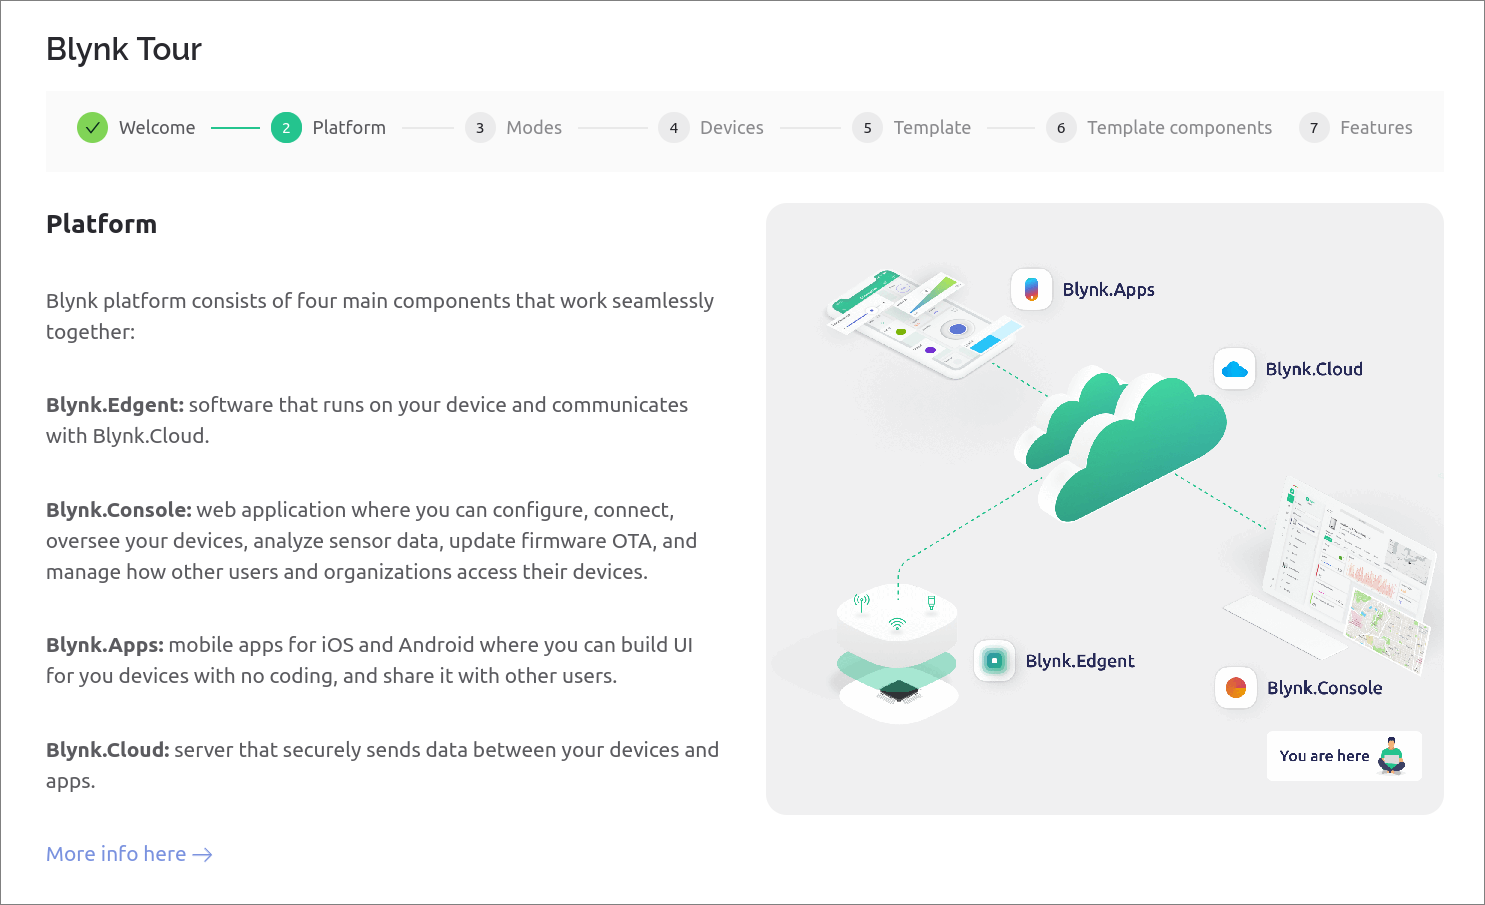
The Blynk onboarding flow after account creation was well designed and worked perfectly for me. I won't repeat that, read the official quickstart docs are here.
Blynk Console
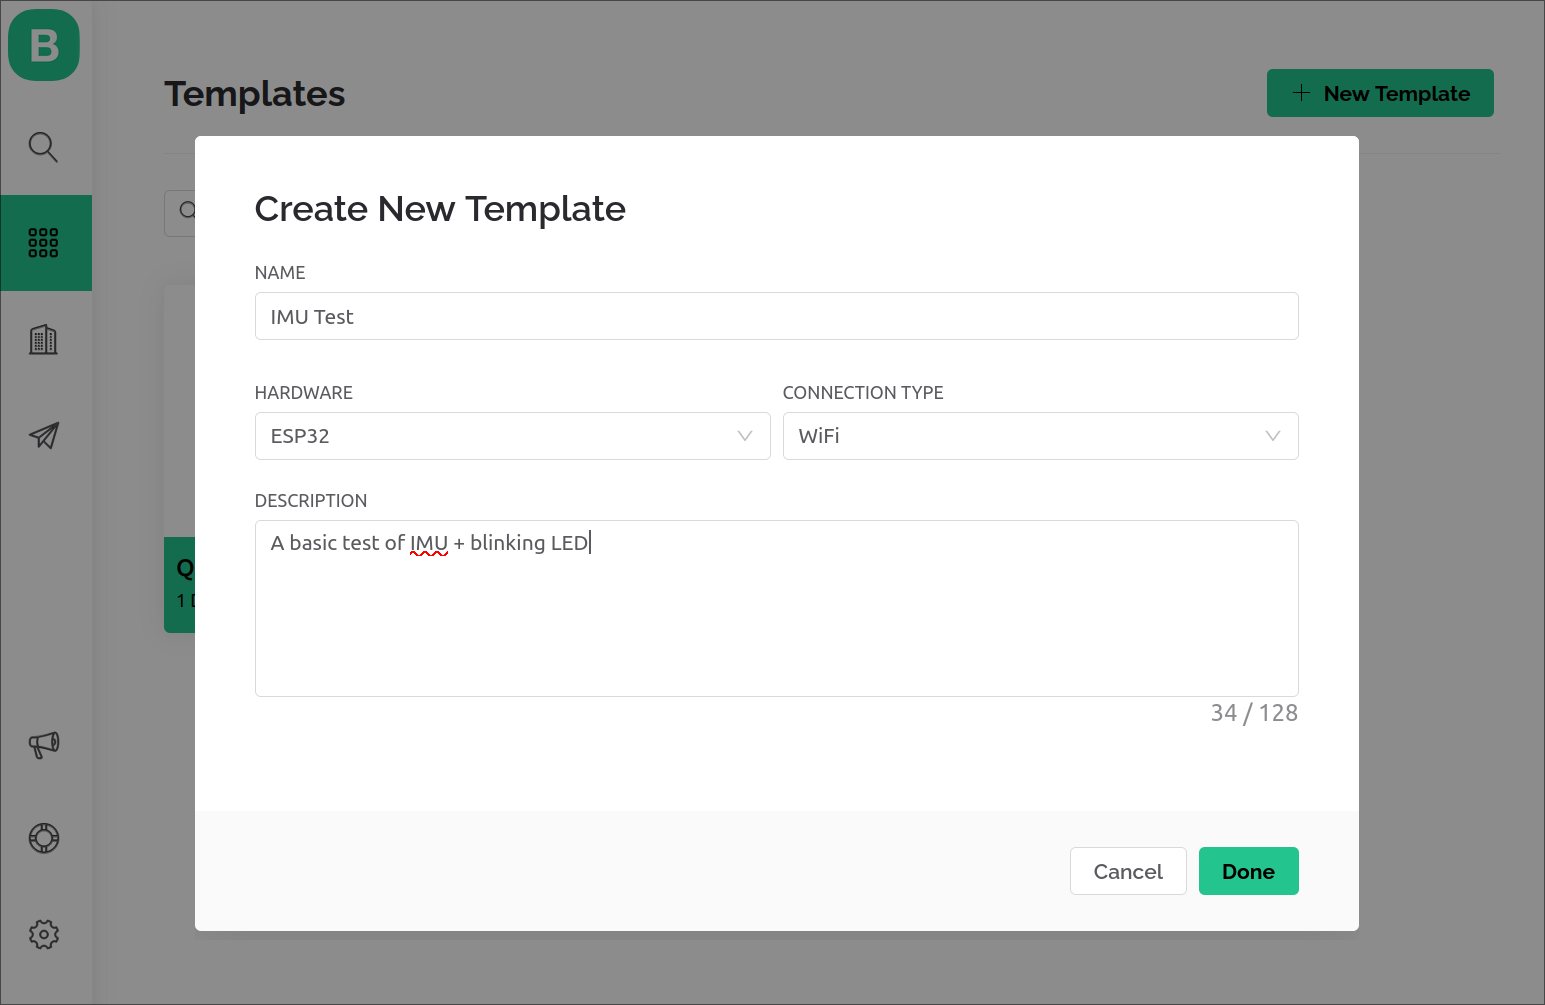
I'll create a new template first. Templates are used to describe the hardware configuration and cloud connected variables for a particular hardware device - each project would specify a different template, allowing identical hardware devices to use a common template.
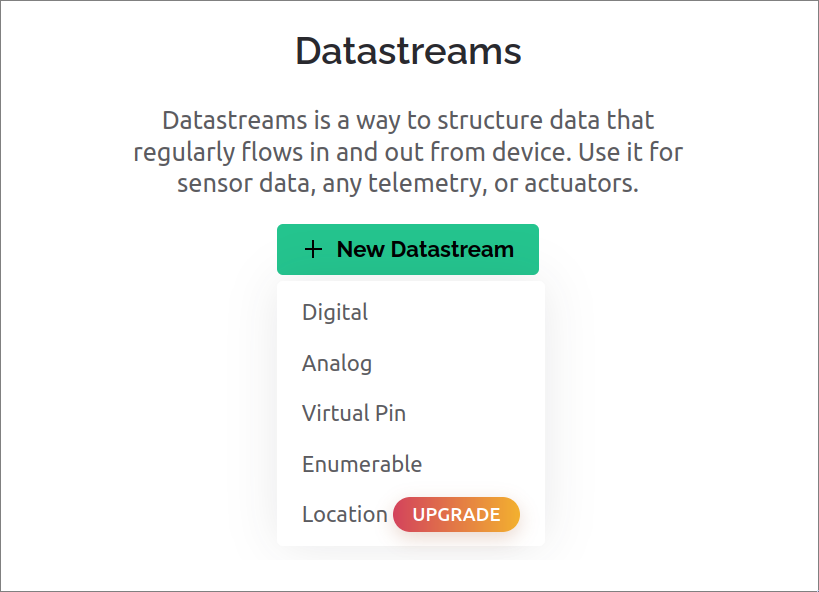
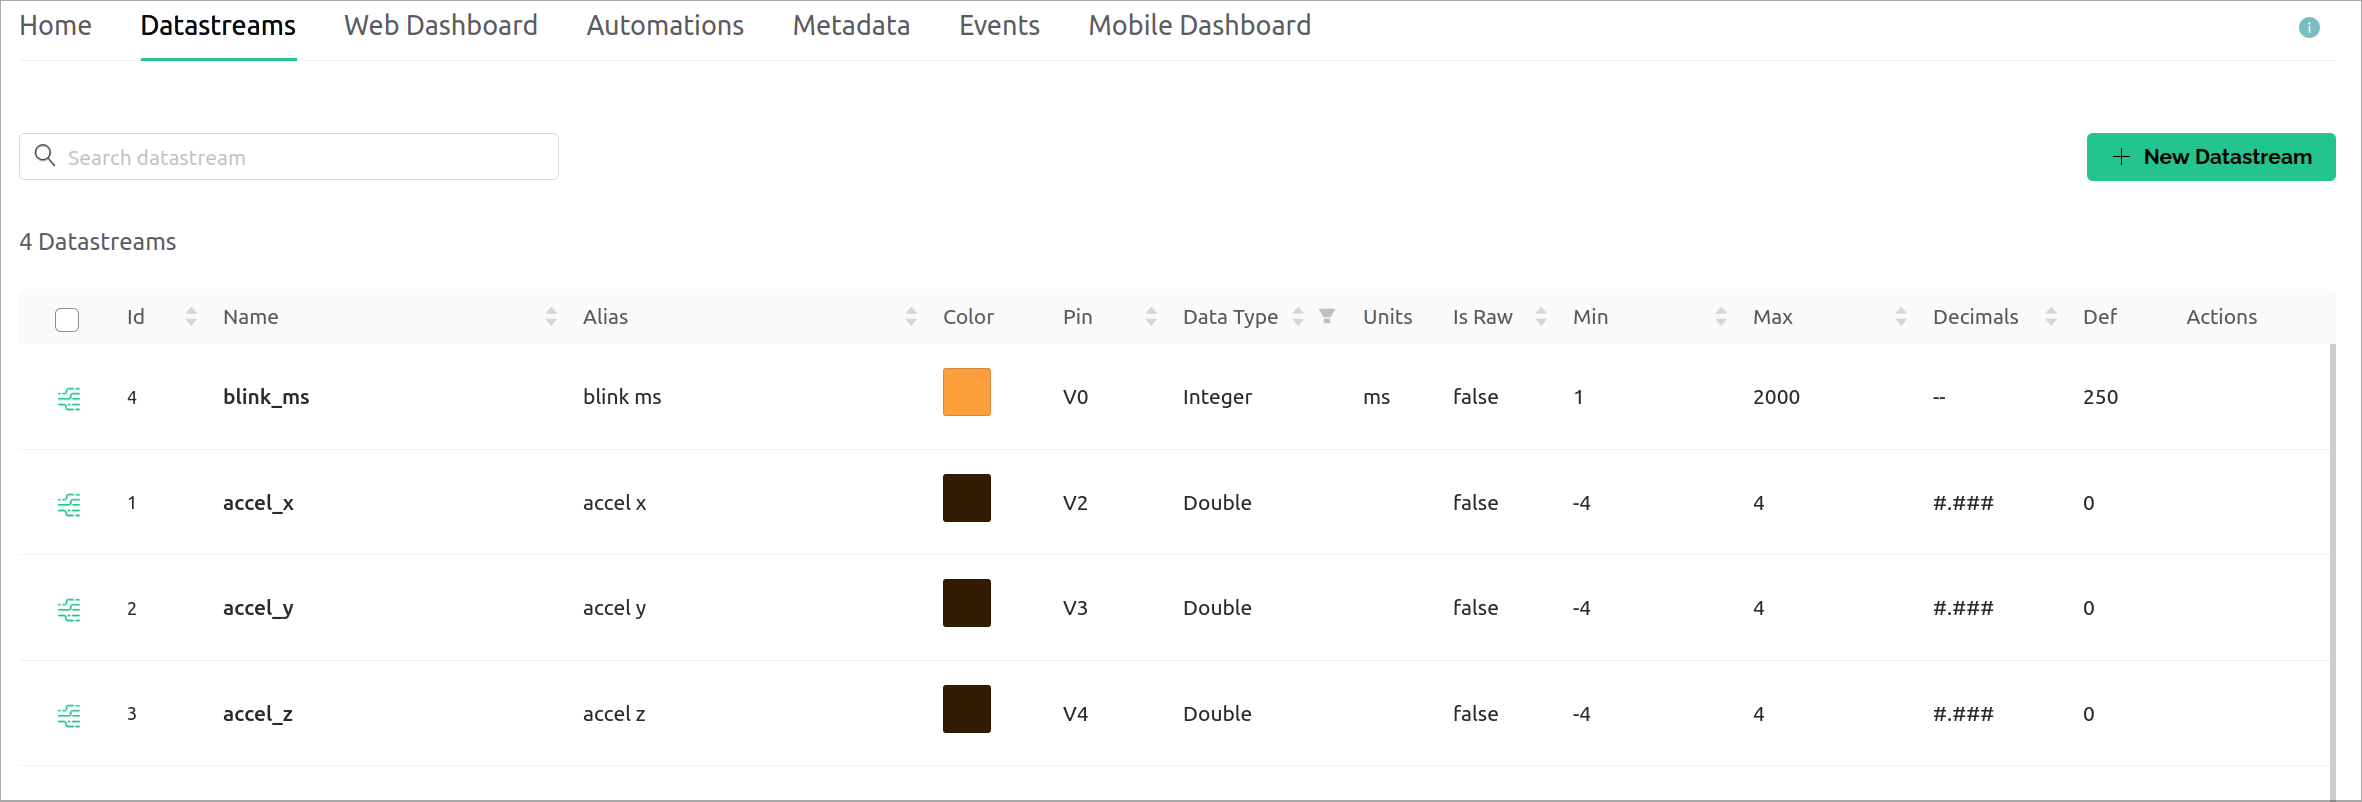
I then added some datastream entries for the accelerometer readings and blink duration control signal.
Blynk's data sharing teminology is based around the idea of 'Pins', and has native digital and analog pin definitions which map to physical IO pins on the hardware. For any other data, a 'Virtual Pin' is used.
'Pins are numerically indexed, appearing to support up to 255 virtual pins. A human friendly name can be assigned, along with the type of data and min/max/default values.
I do find it odd that virtual pins can only be typed as string, integer or double, and from what I can understand, are all encoded and transported as strings behind the scenes.
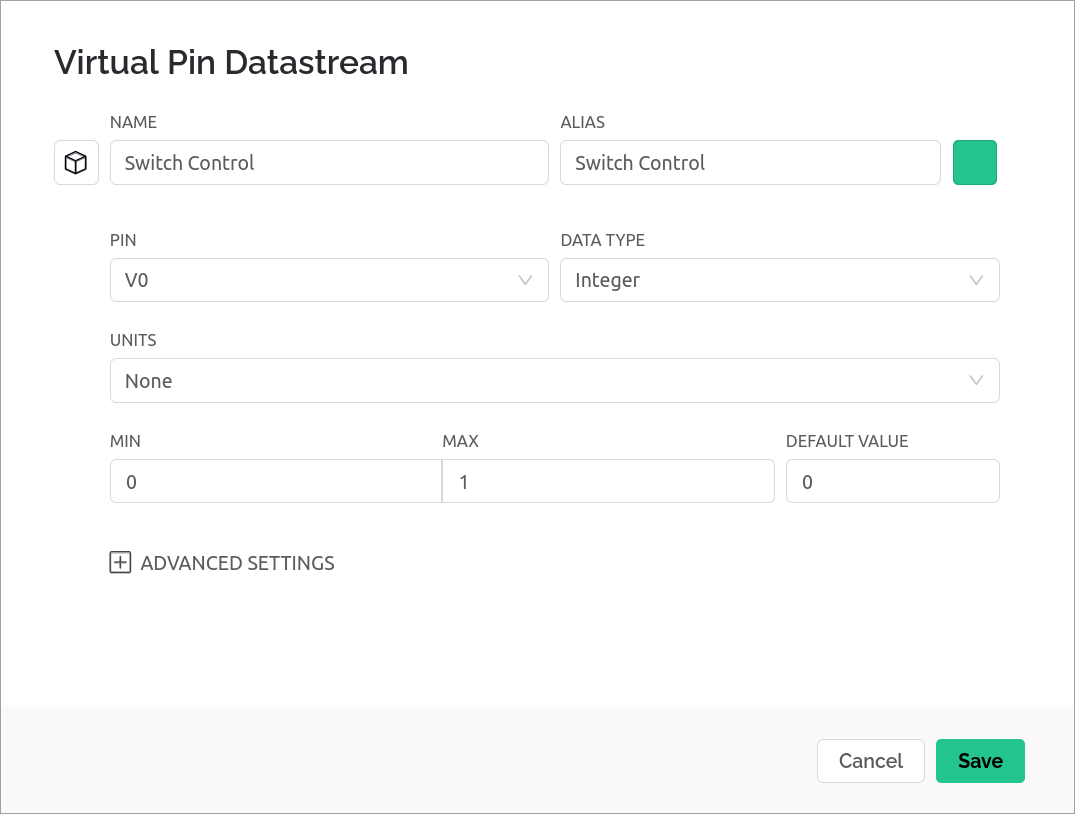
The unit selection looked promising, with a mix of weights, distances, temperatures, but unfortunately doesn't have acceleration or velocity types suitable for the IMU data, so I left the units setting blank.
Millisecond units were available for blink_ms though.
It's now time to get the hardware connected and sending data to Blynk.
Hardware
To get the relevant device key and template config variables to use on hardware, I created a new device and chose the template with configured datastream settings from earlier.
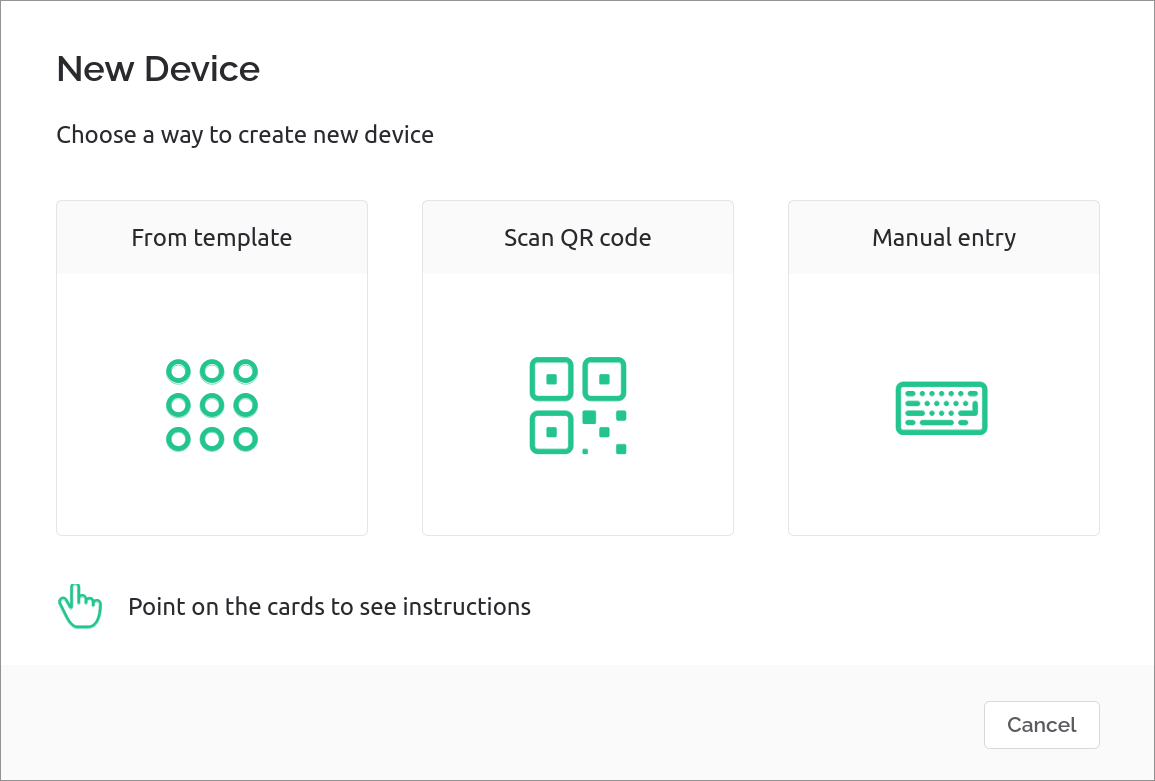
Device creation hints at the larger scale design reasoning for separation of templates/datastream configuration from specific devices - products, community projects or educational kits could quickly provide templates via QR code.
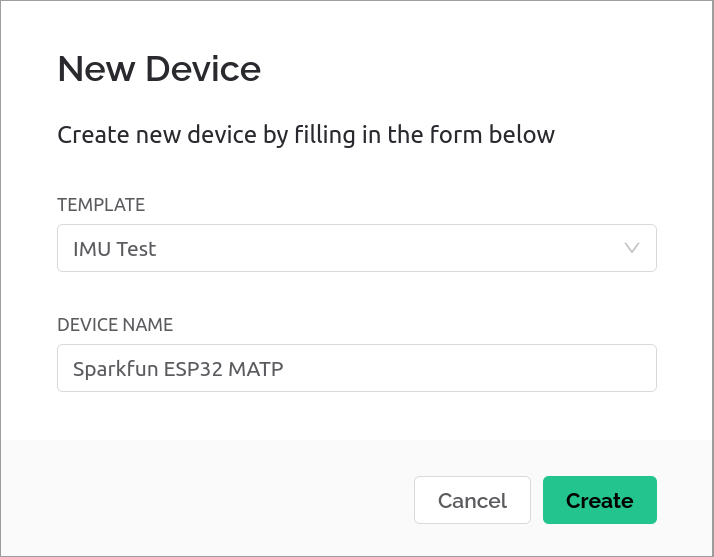
We now have the device configured and are issued the template ID and authorisation token that is needed for the Arduino sketch.
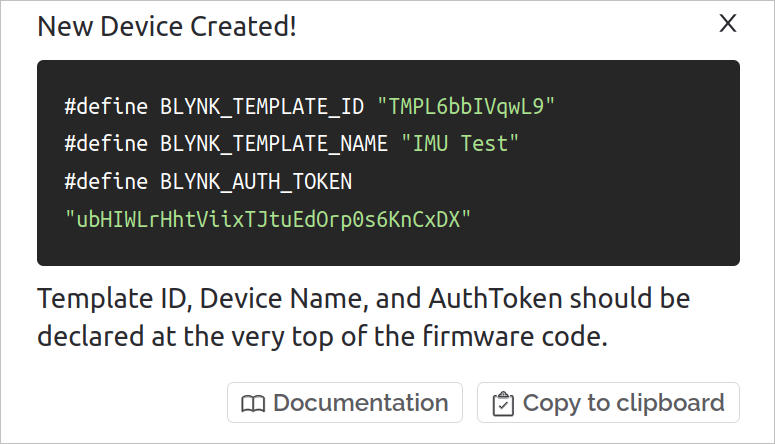
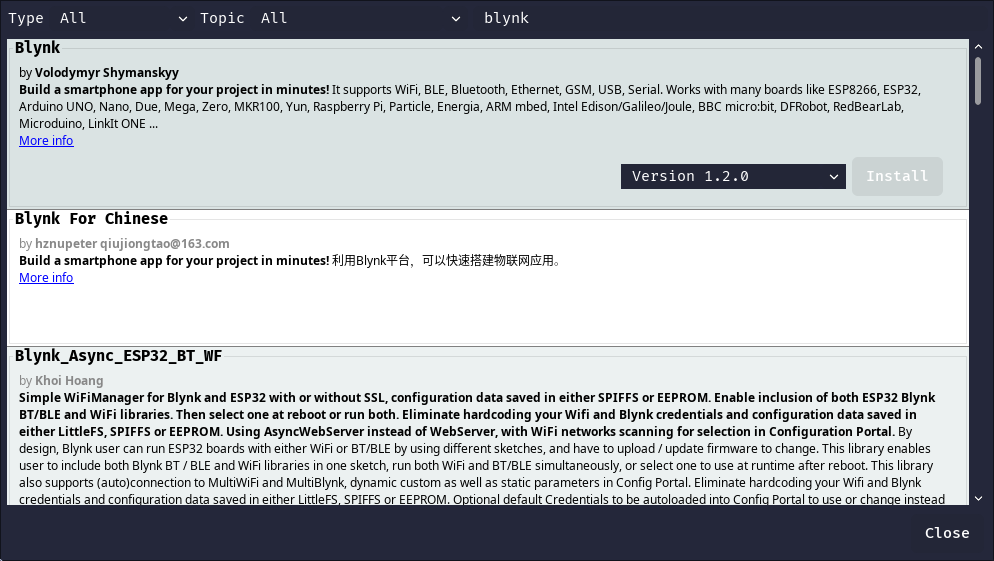
It's a good time to mention that installing the Blynk library was easy with the Arduino Library Manager.
After adding some IMU handling code and configuring a timer to sample and send accelerometer data, my Arduino sketch looks like this:
/* Fill-in information from Blynk Device Info here */
#define BLYNK_TEMPLATE_ID "abc123"
#define BLYNK_TEMPLATE_NAME "IMU Test"
#define BLYNK_AUTH_TOKEN "abc321"

#include <WiFi.h>
#include <WiFiClient.h>
#include <BlynkSimpleEsp32.h>

#include "SparkFunLSM6DSO.h"
#include "Wire.h"

LSM6DSO myIMU; //Default constructor is I2C, addr 0x6B

bool led_on = false;
uint32_t led_timer  = 0;
uint32_t blink_interval_ms = 0;

// Your WiFi credentials.
// Set password to "" for open networks.
char ssid[] = "WifiSSID";
char pass[] = "WifiPassword";

BlynkTimer imu_publish;

// Called when Virtual Pin 0 is changed by the app/web dashboard
BLYNK_WRITE(V0)
{
  blink_interval_ms = param.asInt();

  // Update state
  Blynk.virtualWrite(V0, blink_interval_ms);
}

// This function is called every time the device is connected to the Blynk.Cloud
BLYNK_CONNECTED()
{

}

// Called at 2Hz
void publish_imu_values()
{
  Blynk.virtualWrite(V2, myIMU.readFloatAccelX());
  Blynk.virtualWrite(V3, myIMU.readFloatAccelY());
  Blynk.virtualWrite(V4, myIMU.readFloatAccelZ());
}

void setup()
{
  Serial.begin(115200);

  Blynk.begin(BLYNK_AUTH_TOKEN, ssid, pass);

  pinMode( LED_BUILTIN, OUTPUT );
  led_timer = millis();

  Wire.begin();
  myIMU.begin();
  myIMU.initialize(BASIC_SETTINGS);

  imu_publish.setInterval(500, publish_imu_values);
}

void loop()
{
  Blynk.run();
  imu_publish.run();

  if( millis() - led_timer >= blink_interval_ms )
  {
    led_on = !led_on;
    led_timer = millis();
    digitalWrite( LED_BUILTIN, led_on );
  }
}
I know blindly sampling a sensor in the publish call like this is poor practice.
Don't do what I do here - sample your sensors outside of telemetry sub-systems to better control timing. Even better, use interrupts for new sensor data notification instead of polling!
Building a dashboard
With hardware setup and publishing data to Blynk, we're ready to configure a web dashboard and a mobile app layout.
Blynk doesn't allow layout re-use between web and mobile, so I'll treat them as individual dashboards.
Web
The web builder provides a grid for UI components called 'widgets', and uses a drag and drop approach for layout with a grid for alignment and resize snapping.
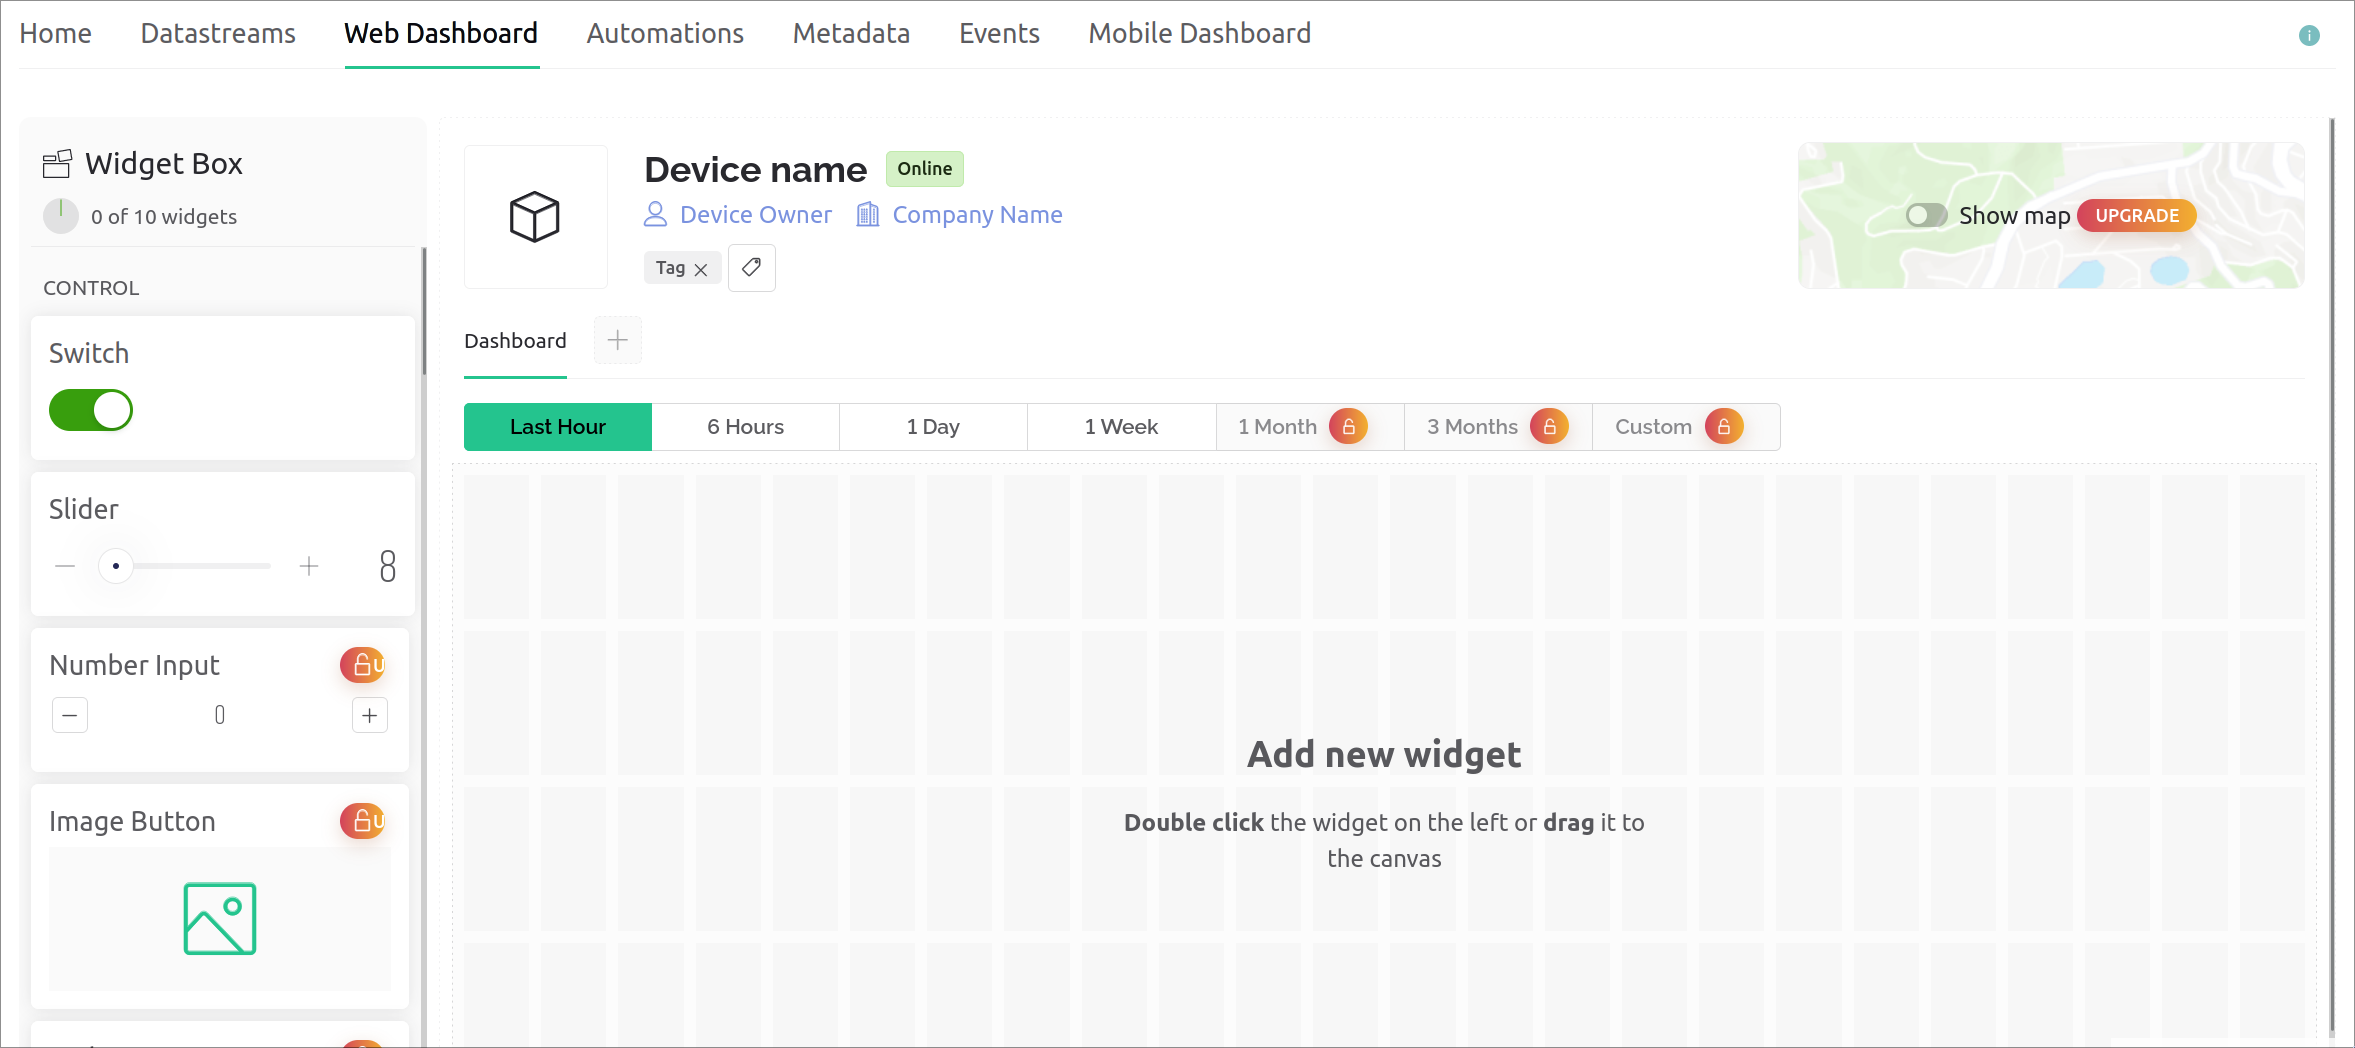
The orange upgrade buttons covering the interface make it rather obvious that a large part of Blynk's functionality needs a paid tier.
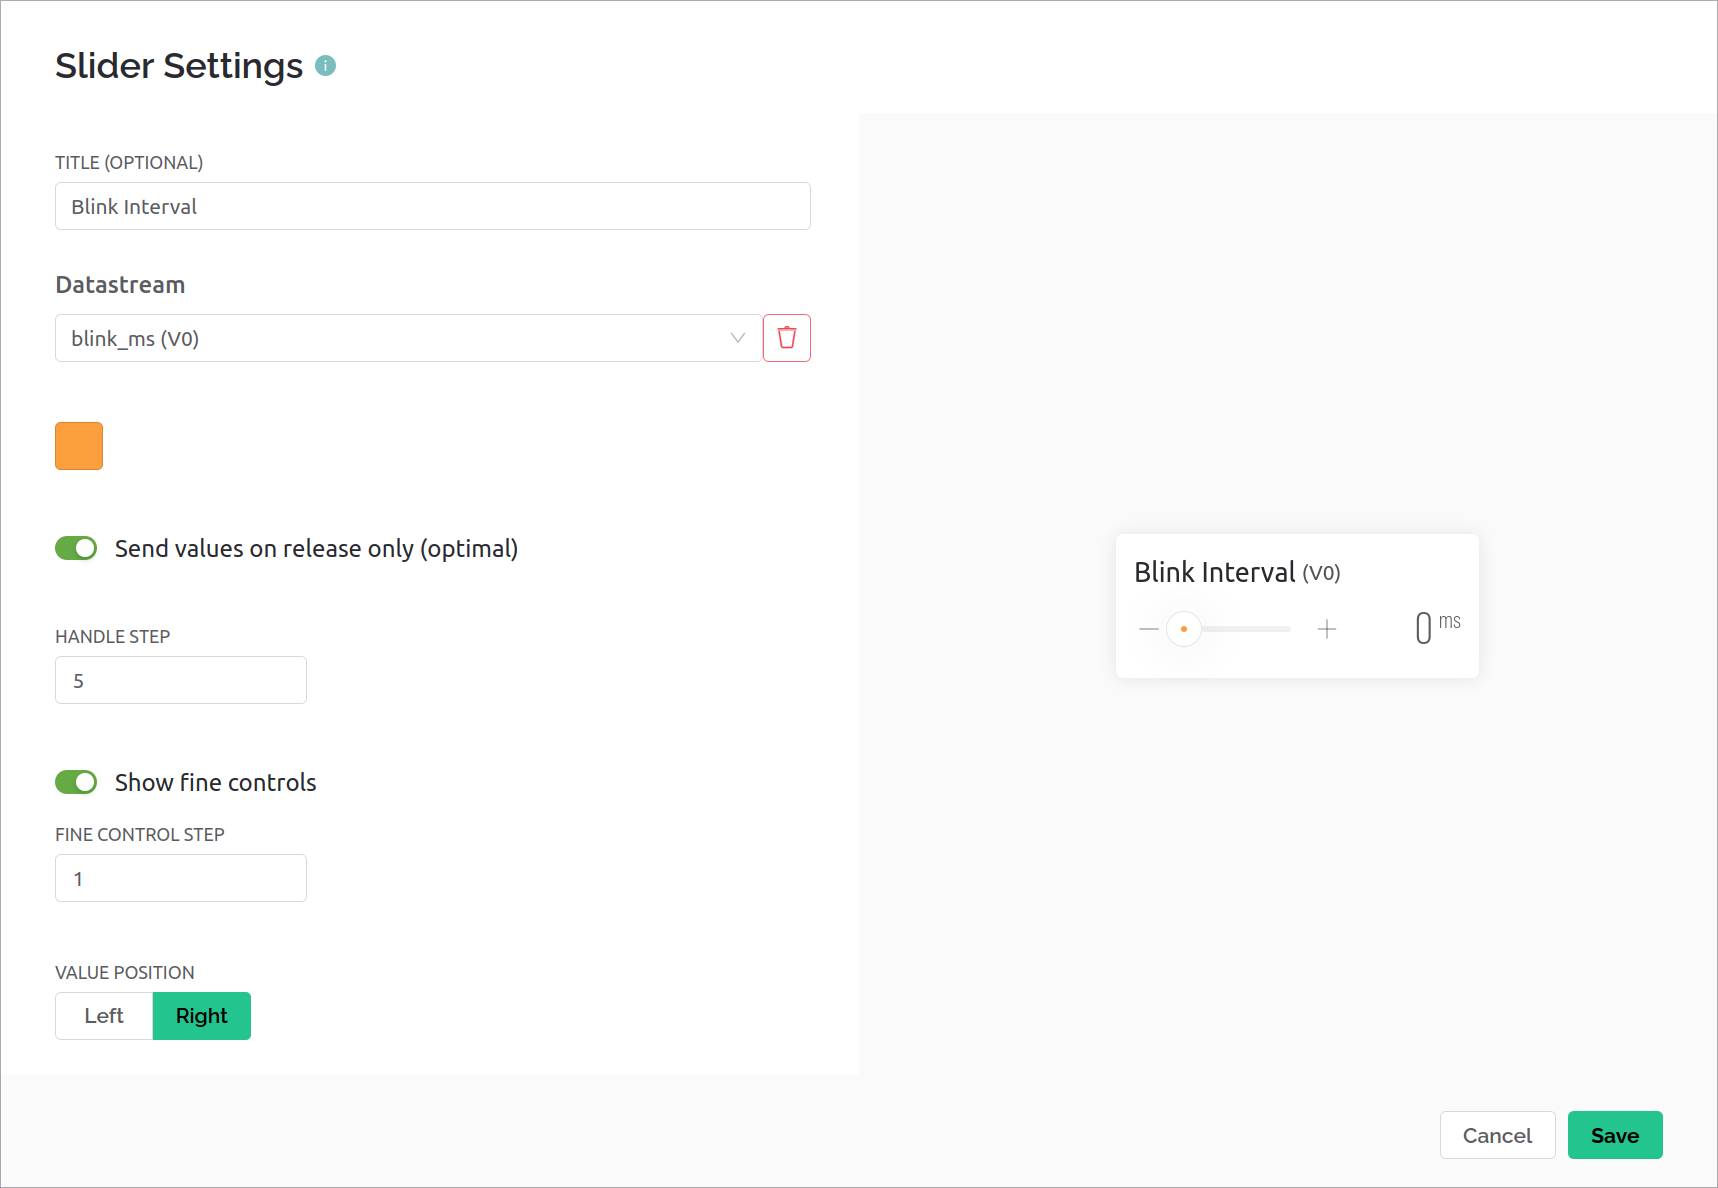
Adding a slider for the blink_ms functionality was easy, and it automatically added a "ms" suffix behind the value.
The configurable title, layout and handle color are nice to see compared to other web-dashboard builder products.
Adding the value text and chart were similar, and I've now achieved the basic test requirements.
The chart is limited to one signal for the free plan.
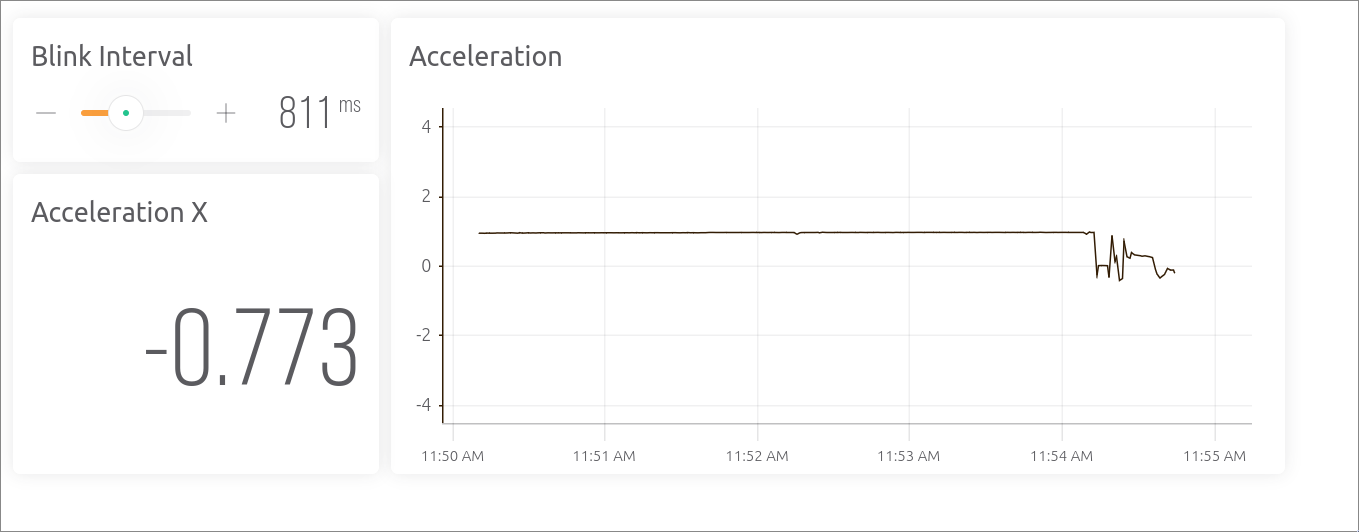
It looks professional and stylish by default.
The chart updates every second when the dashboard is set to "Latest", even though the ESP32 is publishing at twice that rate. For the longer timespans like "Last Hour", the charted data is decimated to one-minute resolution.
Mobile
After downloading and logging in, I could see the device I setup waiting. Once again, the onboarding experience looks good and explains everything well.
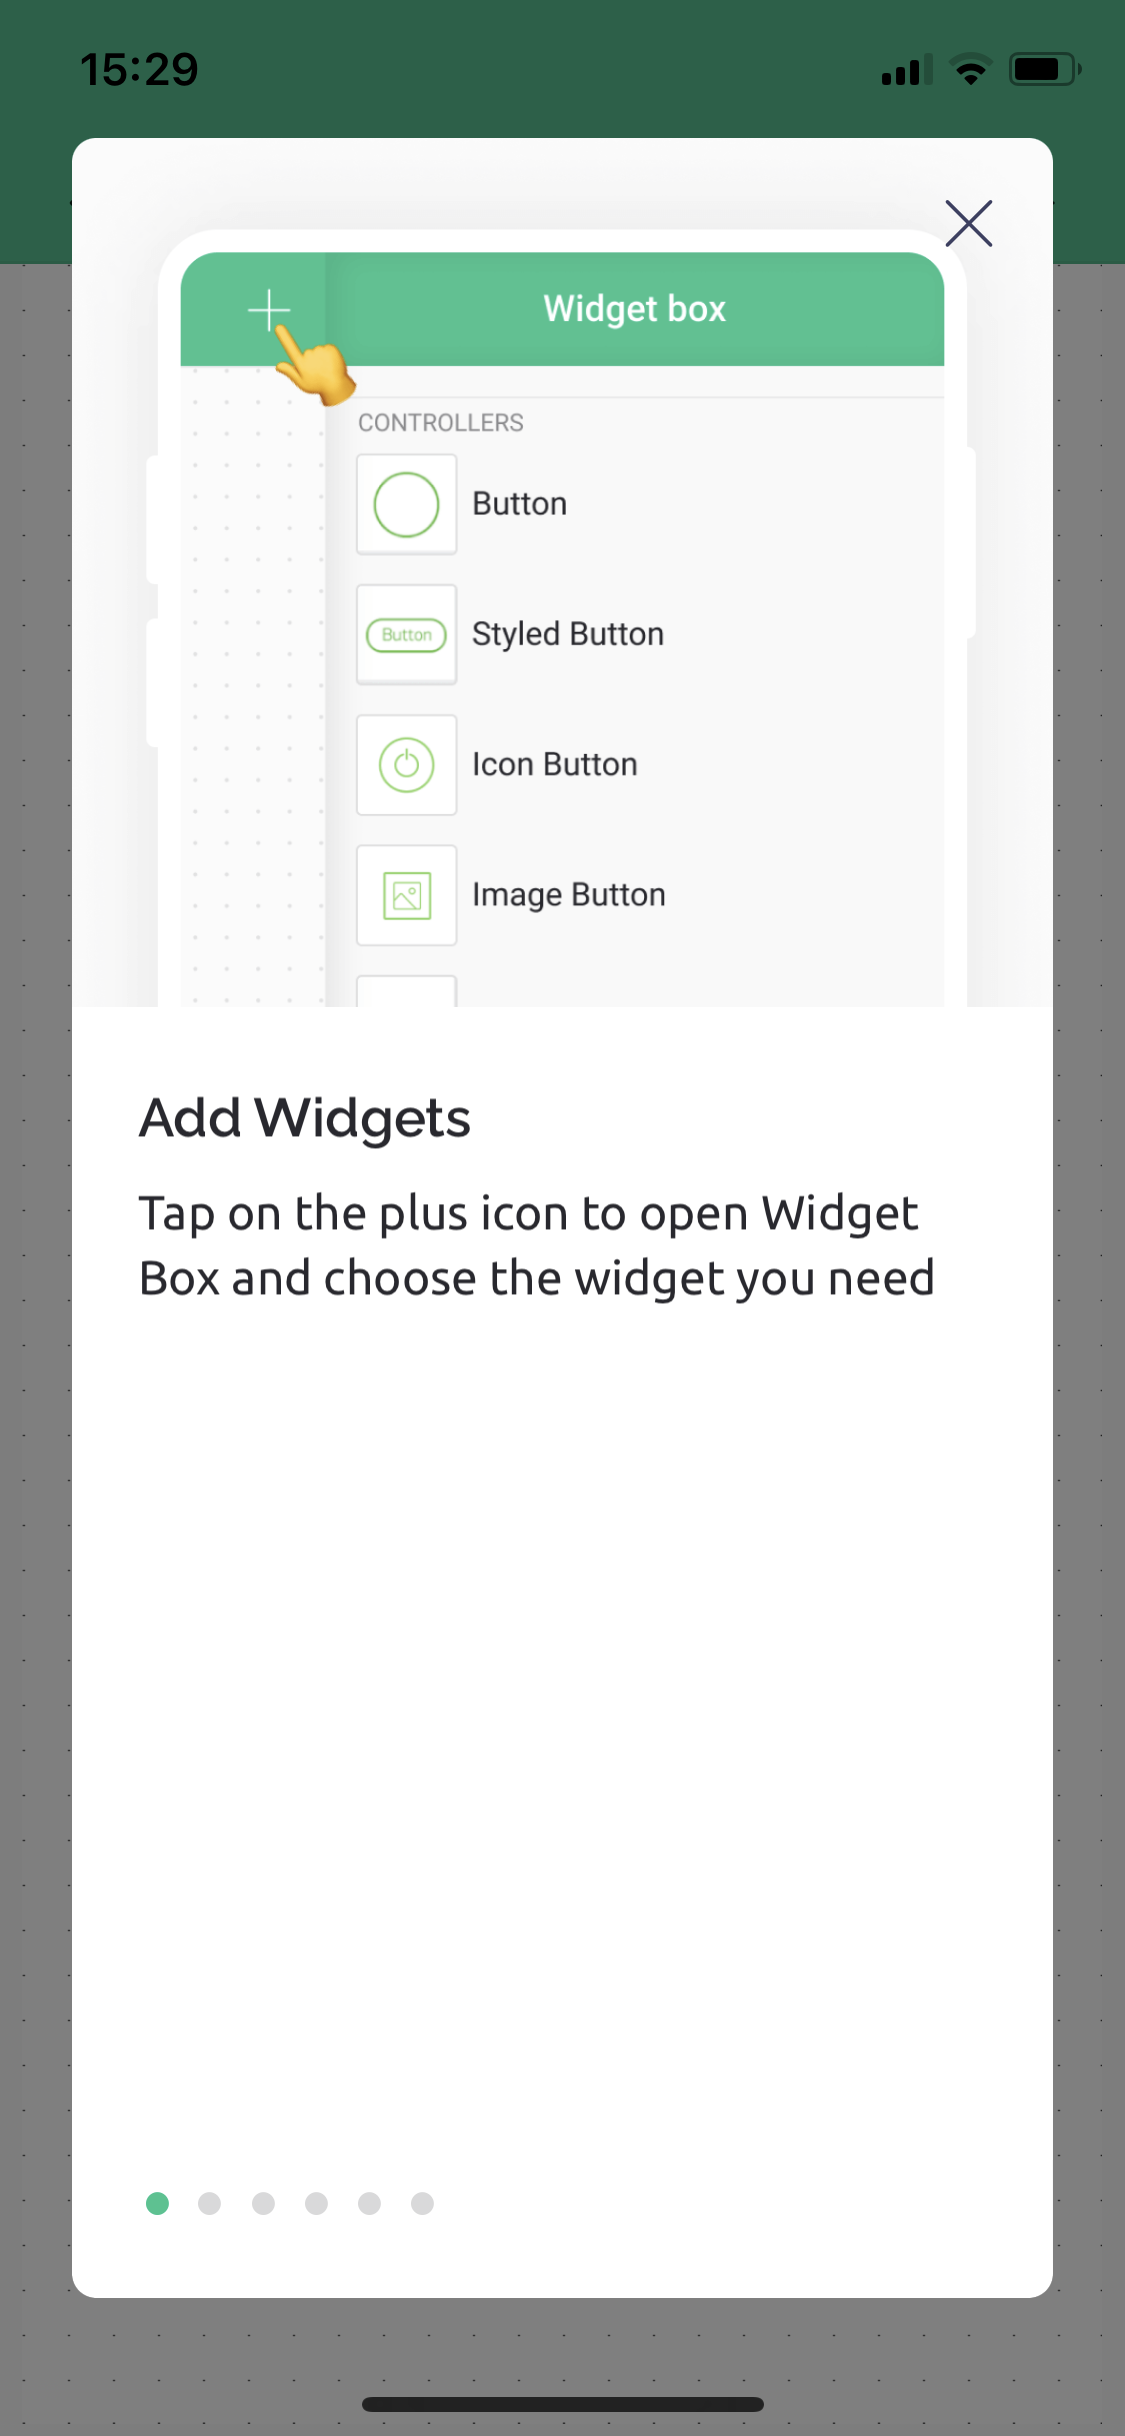
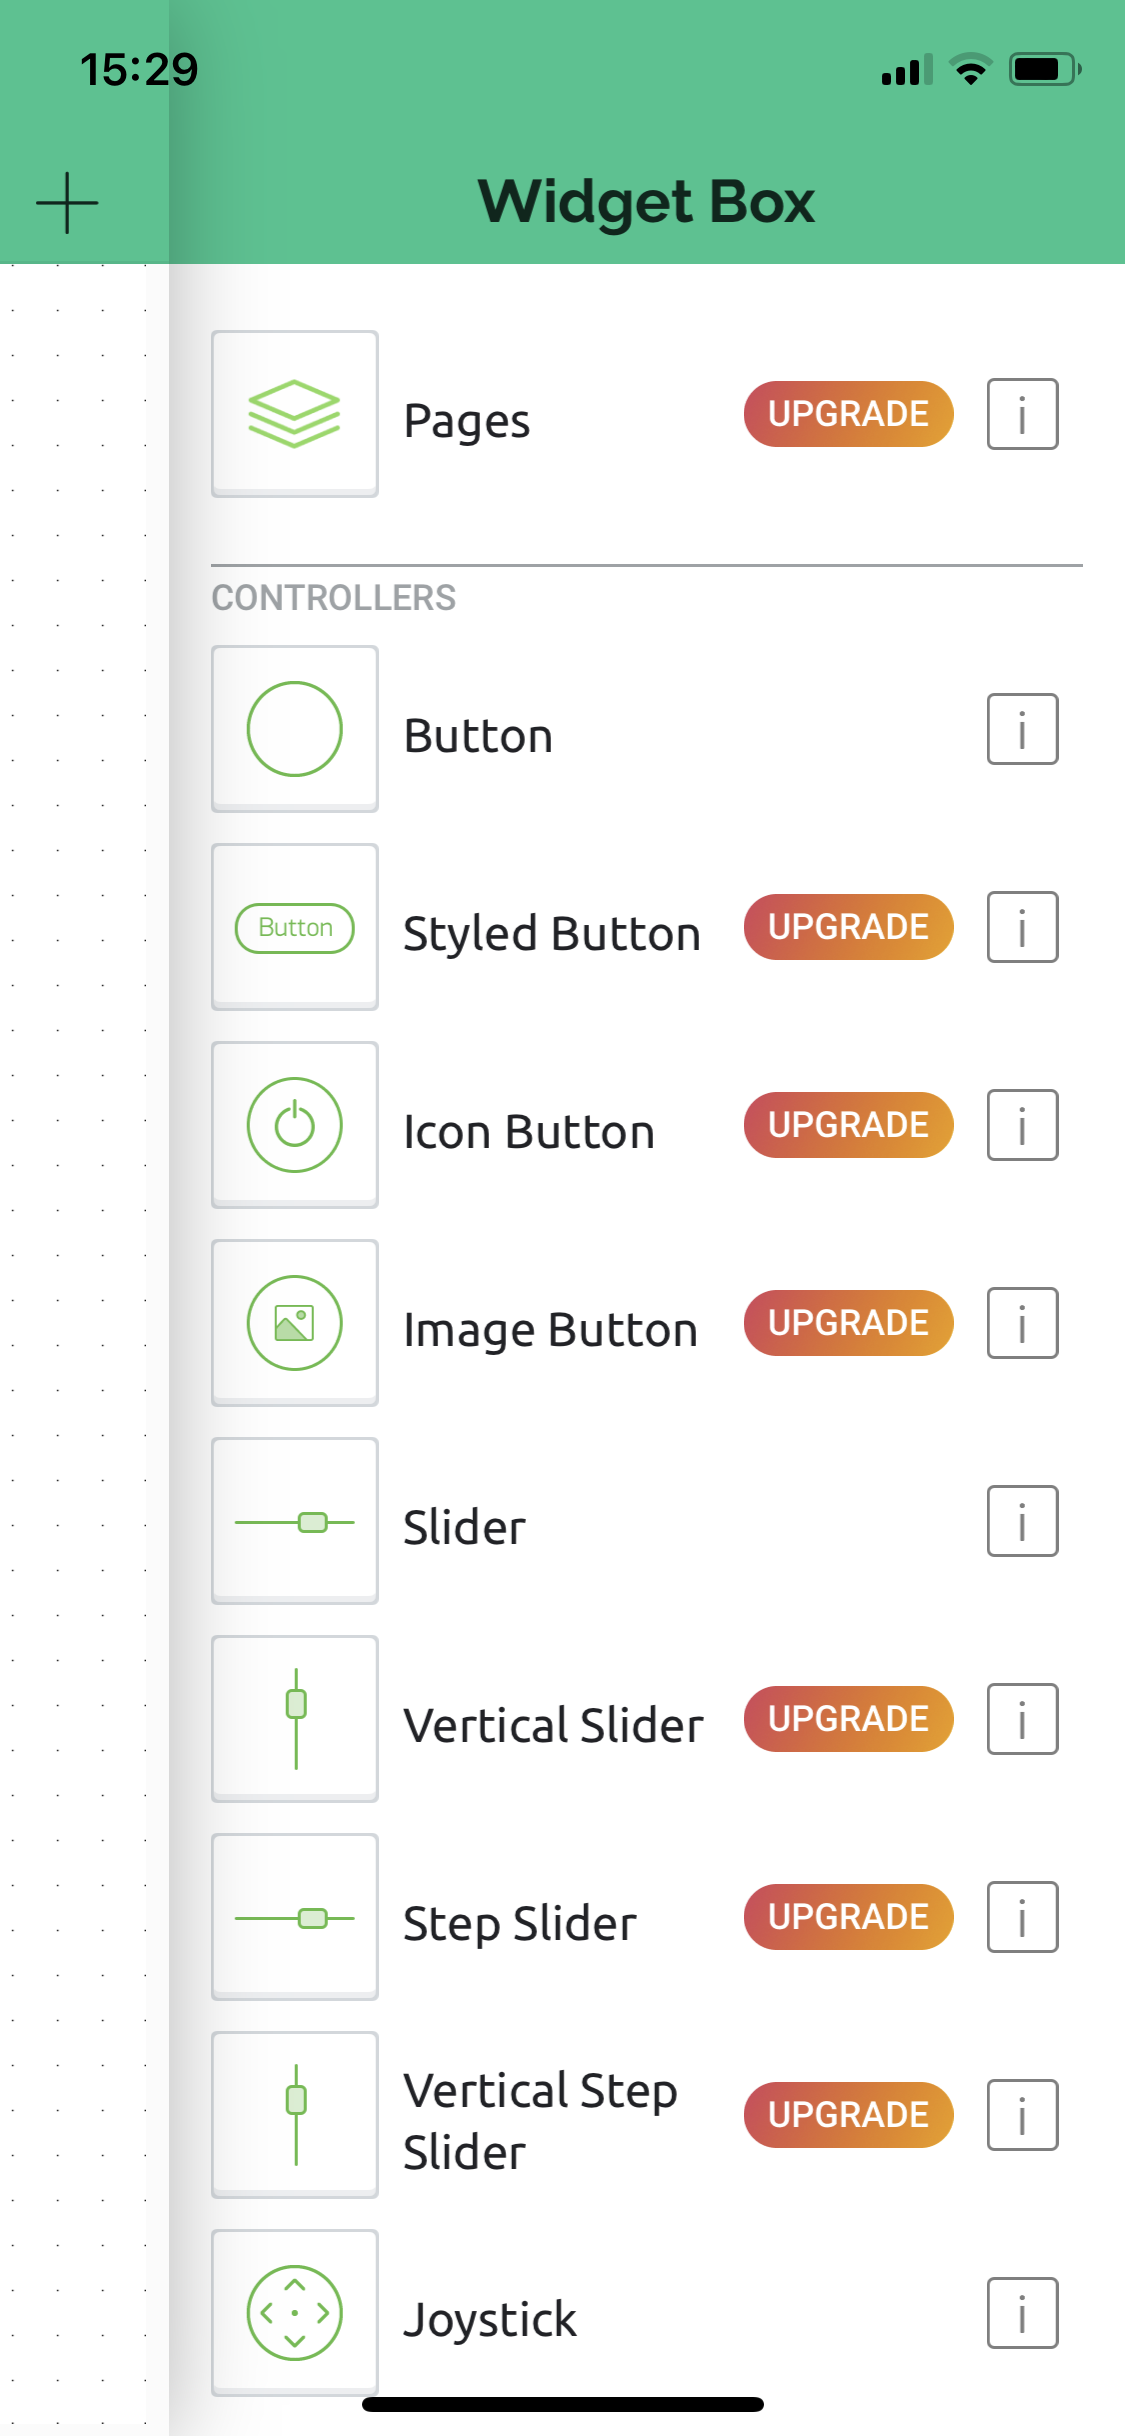
Changing to 'developer mode' allows for a similar drag-and-drop layout experience. Just like the web builder, a lot of the widgets require a paid tier plan.
I was impressed with the wider range of widgets available, but the list is also cluttered with horizontal and vertical versions of the same widgets instead of using a styling toggle.
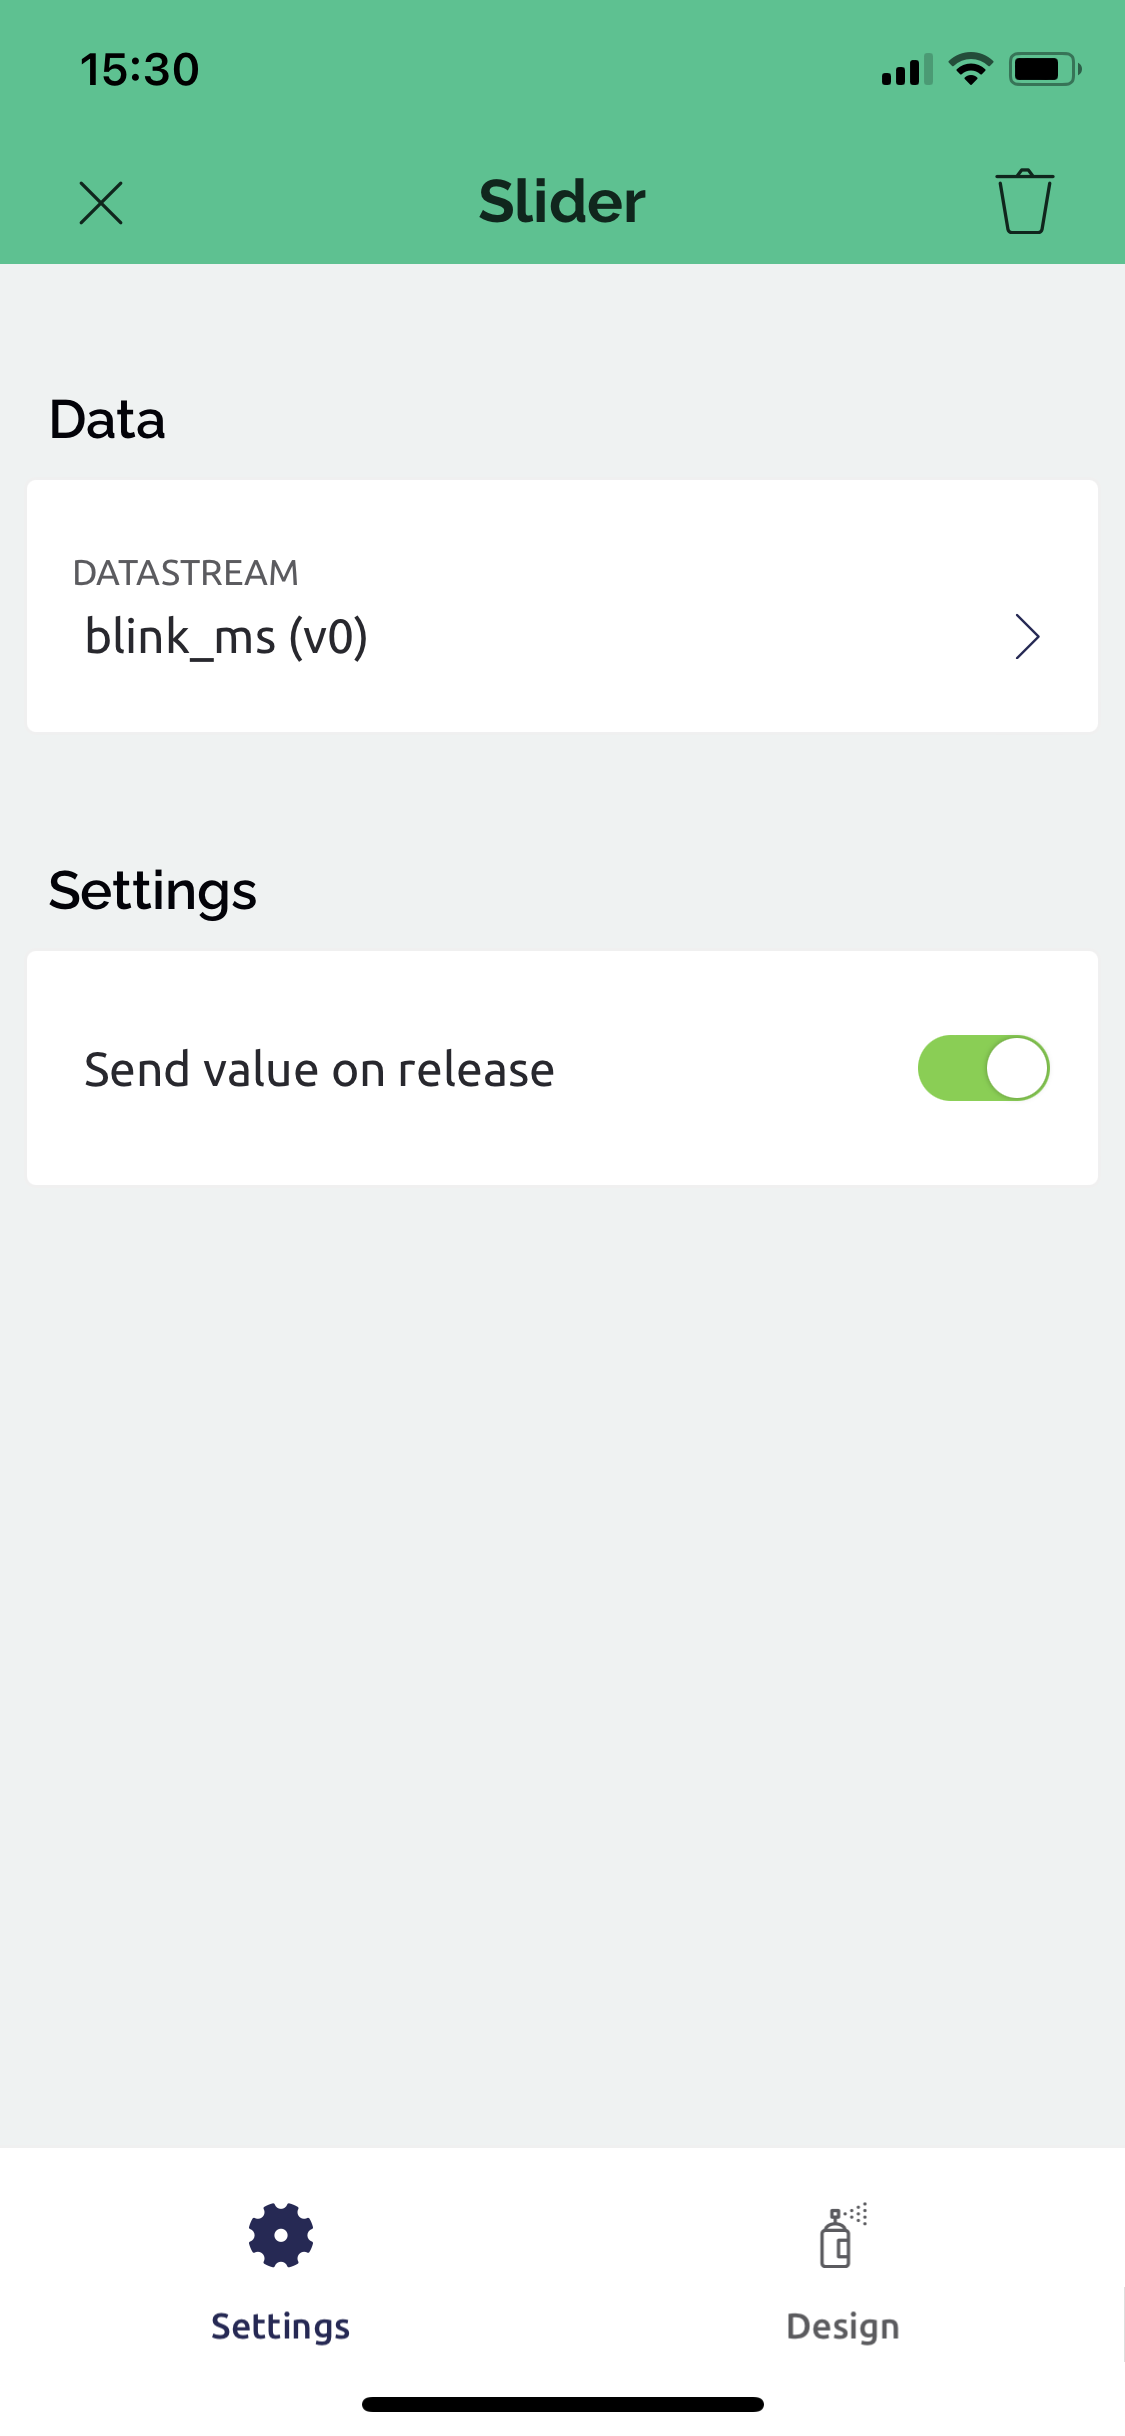
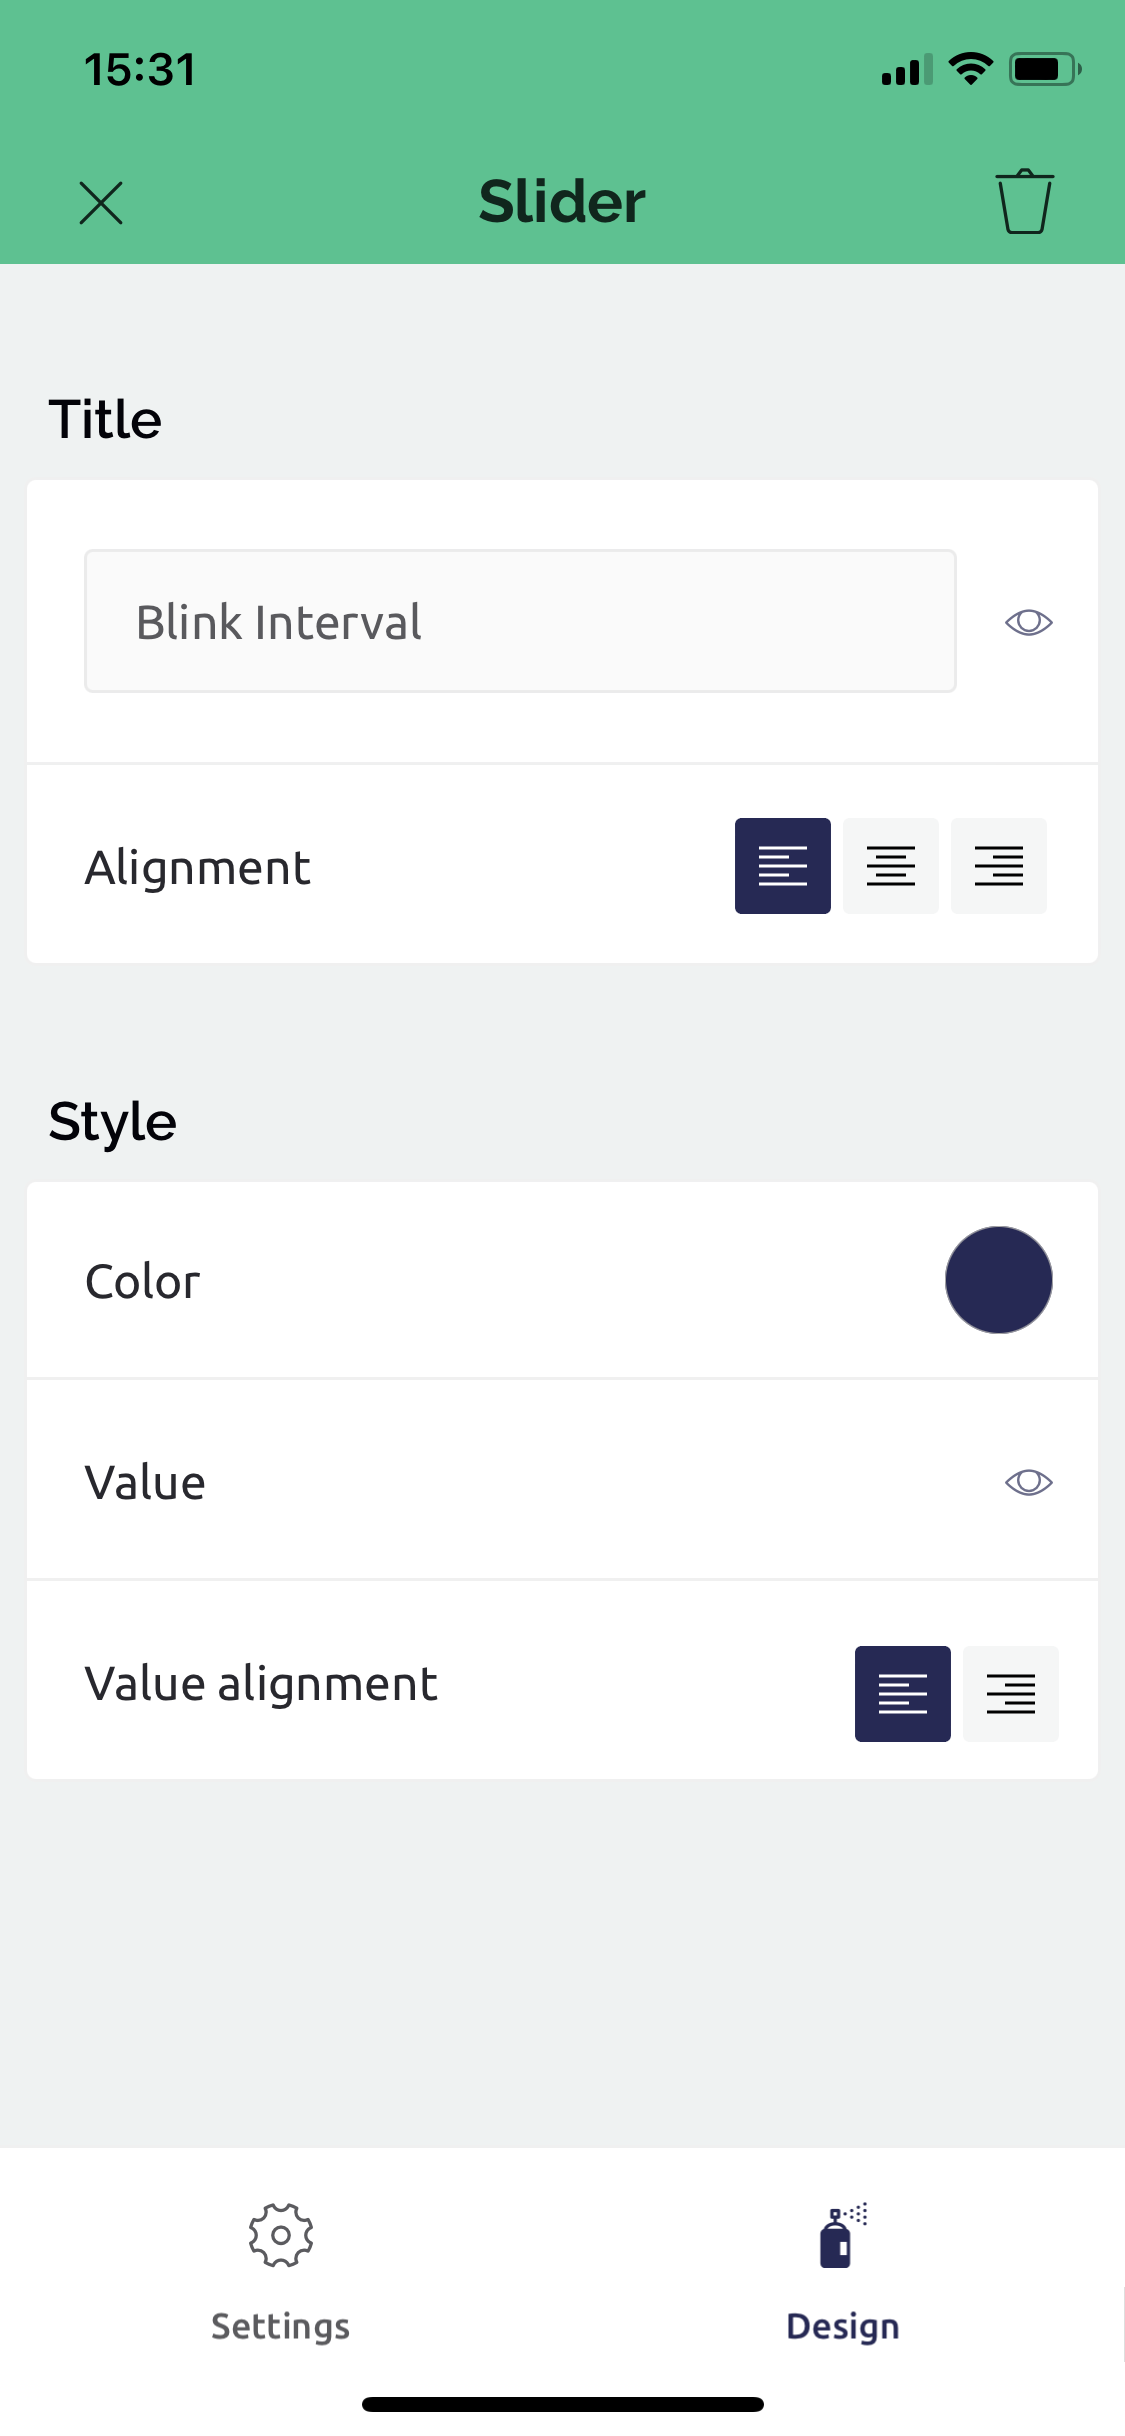
The configuration for the Slider component worked well, selecting the datastream and allowing for visual customisation.
With the rest of the components dragged in, resized and configured, I can see how the mobile app handles presenting the UI for the basic test.
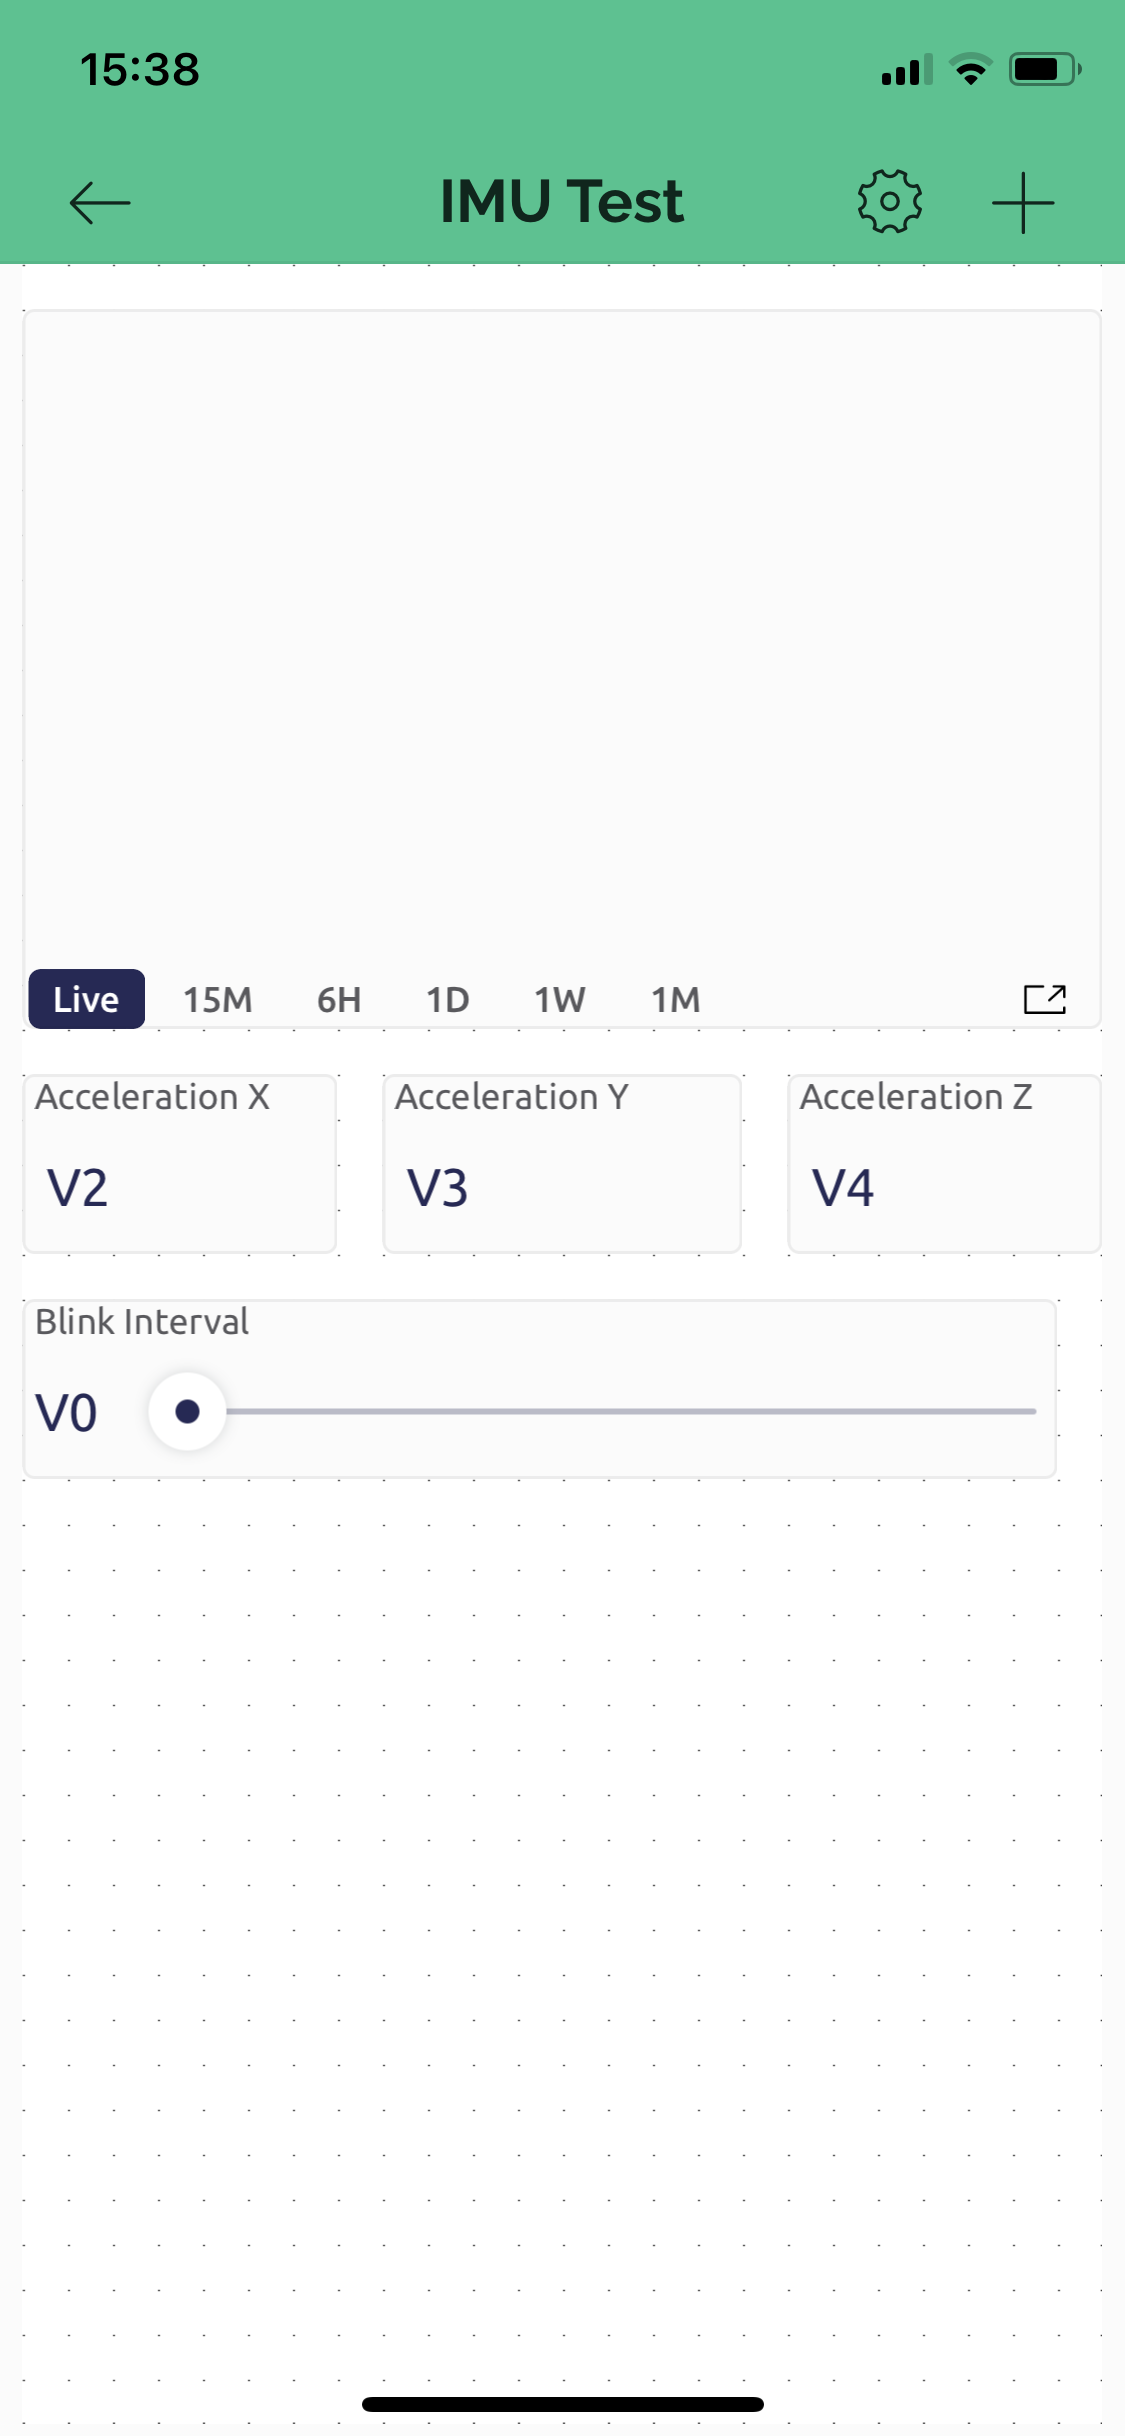
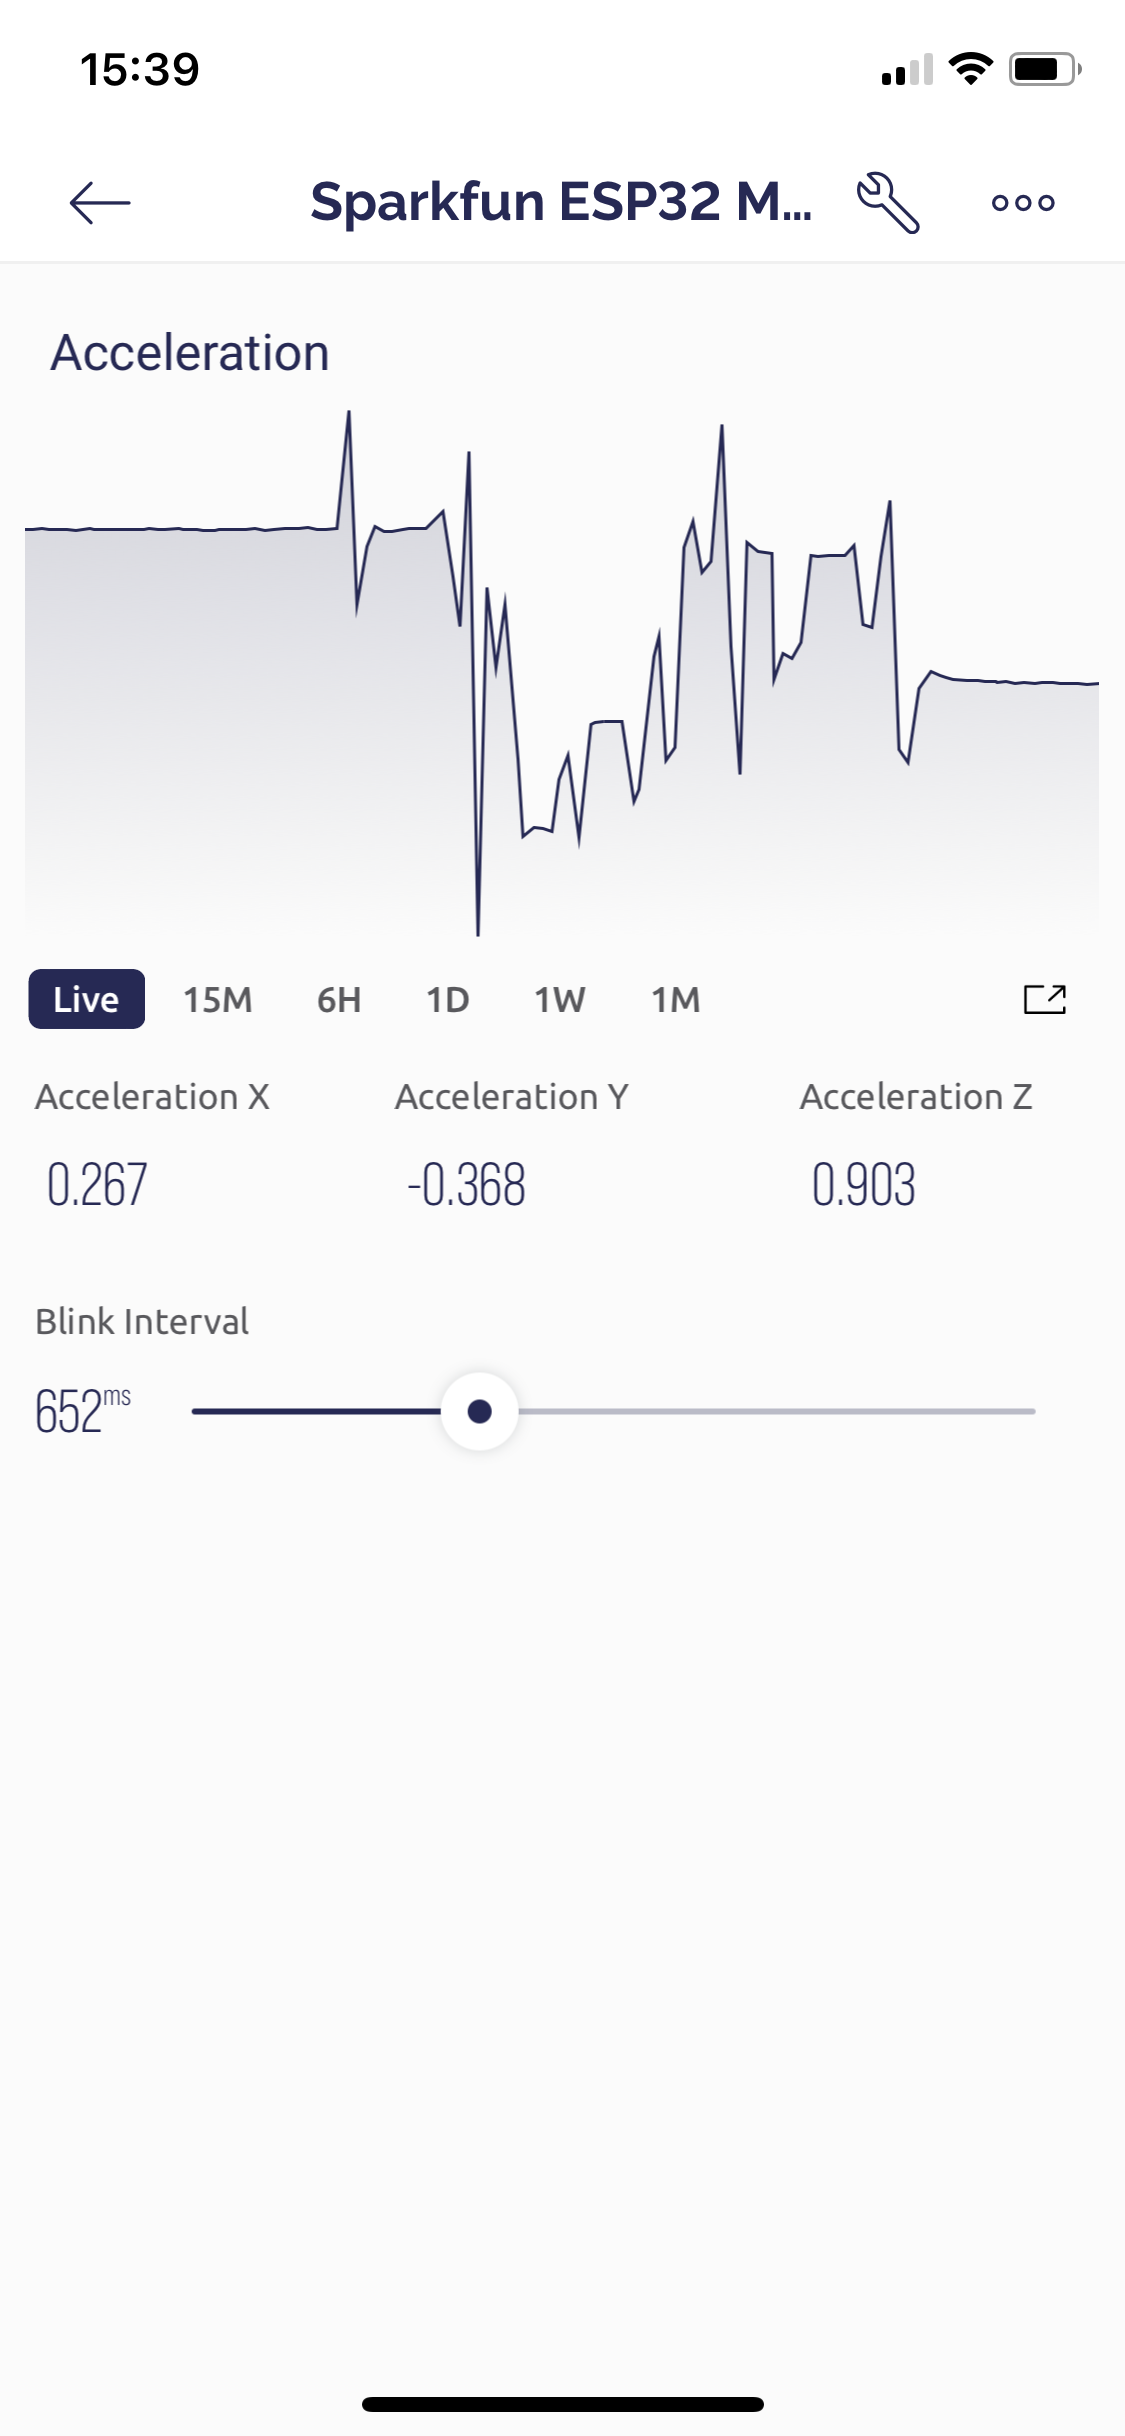
This looks good, responds well to touch input, and behaves as expected when switching apps or closing the app.
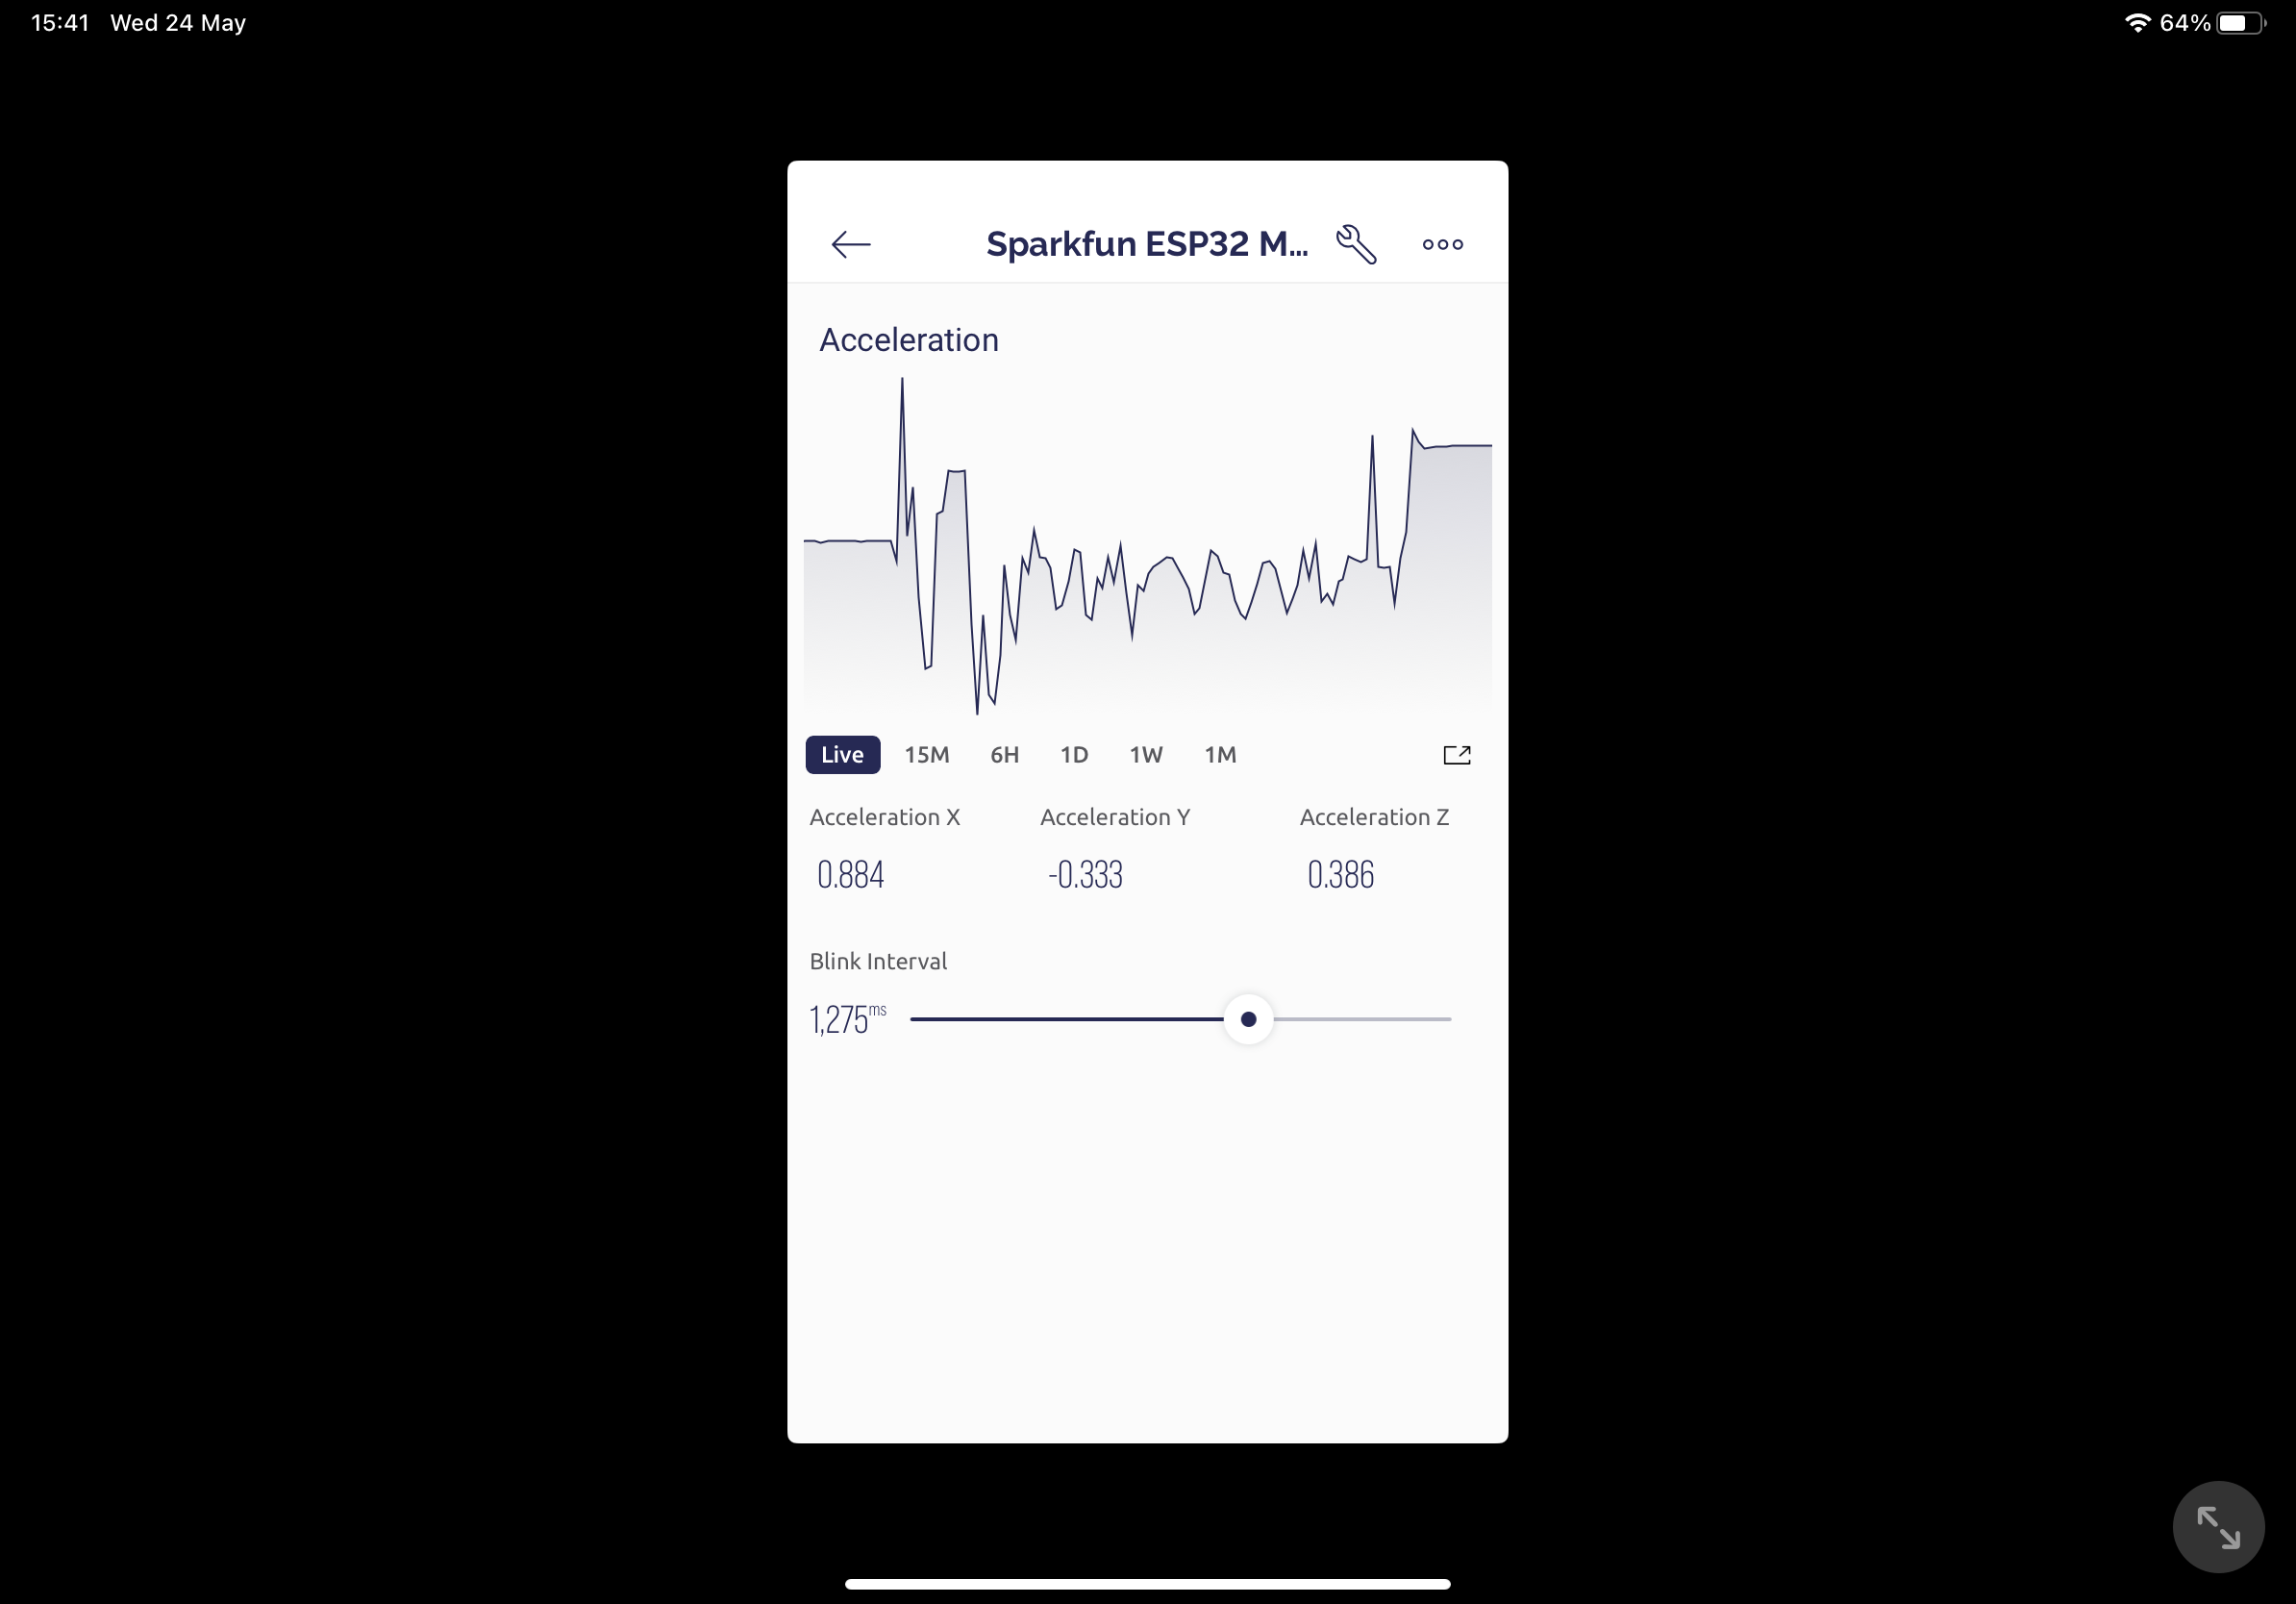
The iPad app however, only runs in iPhone compatibility mode. Logging in on the iPad did allow for immediate use of the dashboard configured on the phone, so that's nice at least...
Summary
In general, the quality of documentation, onboarding flows and hardware setup was very good. The web and mobile interfaces look modern and feel performant, and everything worked as expected.
The mobile app has a larger set of widgets available for control and data visualisation. Some widgets which required a paid plan for use on the web are freely available on the mobile app. On the topic of the mobile app, seeing the iOS app run in phone compatibility mode was surprising given the otherwise high level of polish and attention to detail.
I'll also point out that editing interfaces on a phone is more tedious than the web interface, and feels like a missed win for improved usability.
The Blynk documentation suggests restricting hardware variable publish rate to not exceed 10 values per second. This is reasonable from the perspective of a cloud service, but shifts responsibility to catch important events to the firmware, rather than sending a wider stream for decimation at the database level.
I measured the time taken for Blynk to publish a single static double precision value at 1.9 milliseconds. The micro blocks during this time, so you might need to be careful when you publish values.