Arduino Cloud is a series of web-based features which aim to provide Arduino users a pathway into low-code development, machine-learning, IOT behaviours, and online dashboards.
Dashboard Experience
Web Interface
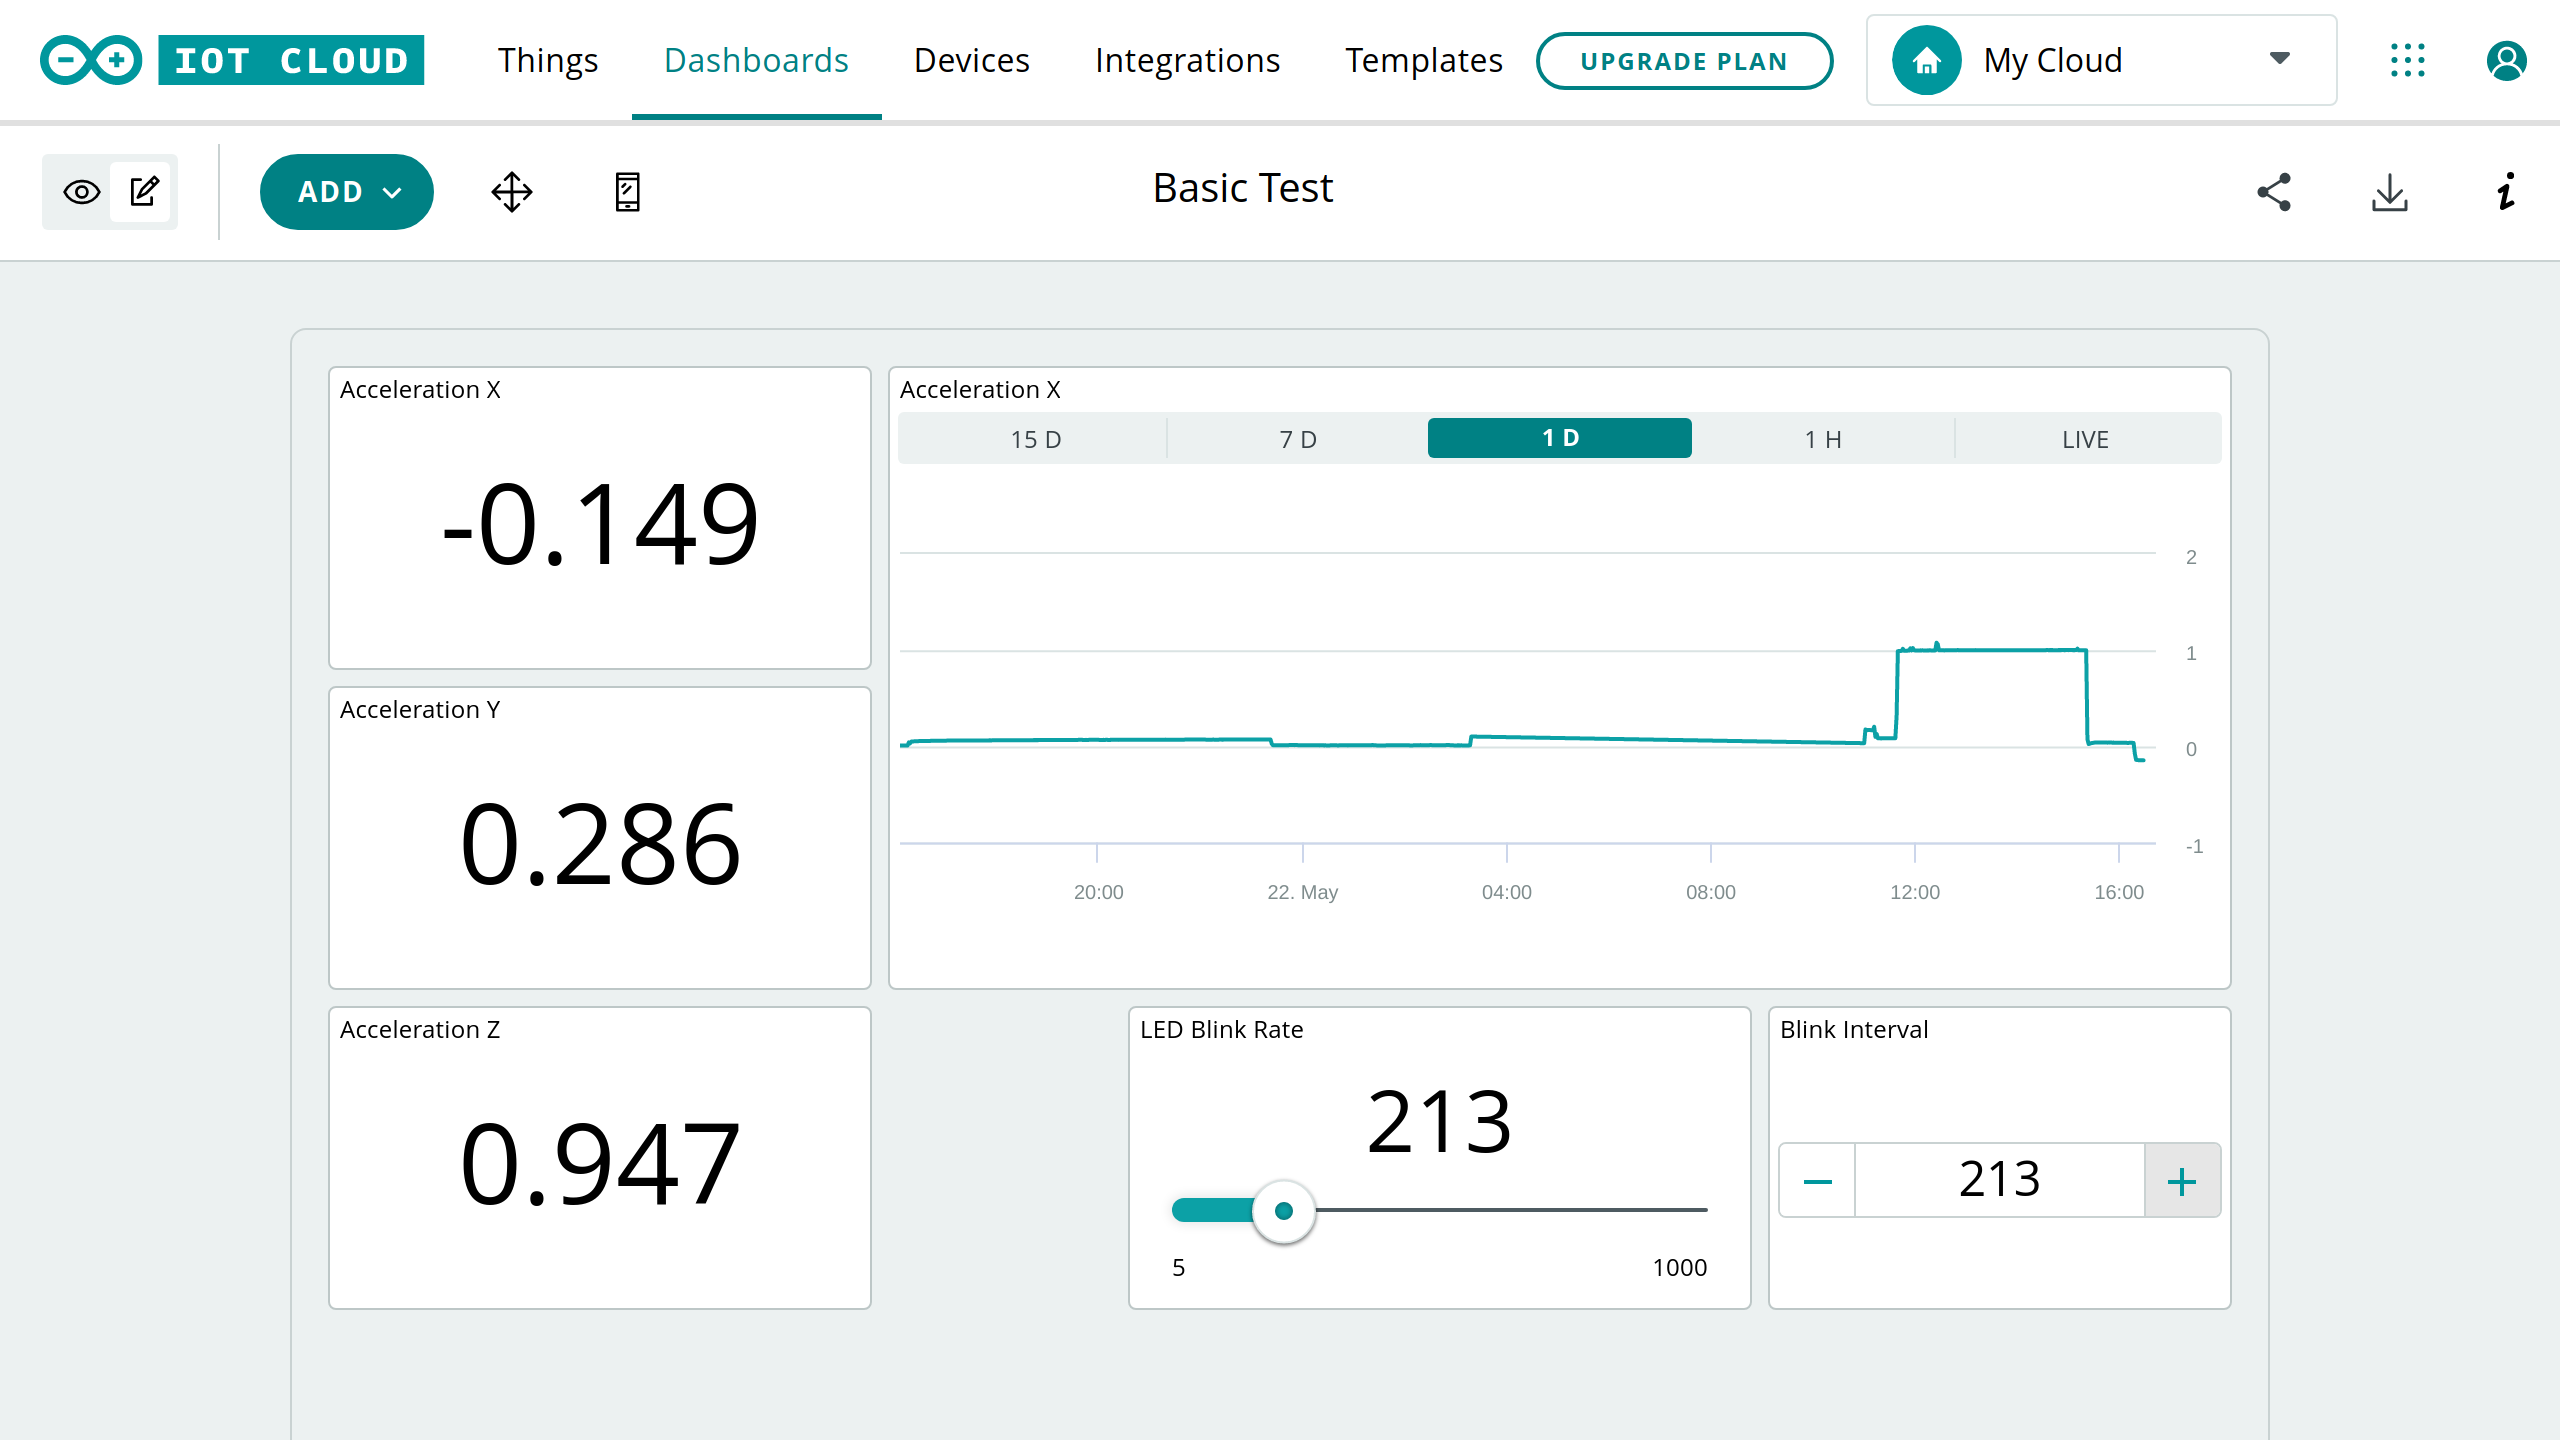
The dashboard builder tools are intuitive and easy to use.
Most controls are provided with a small taskbar above the dashboard which change the view/edit mode, allow adding components, moving them, and toggling between mobile and web layout views.
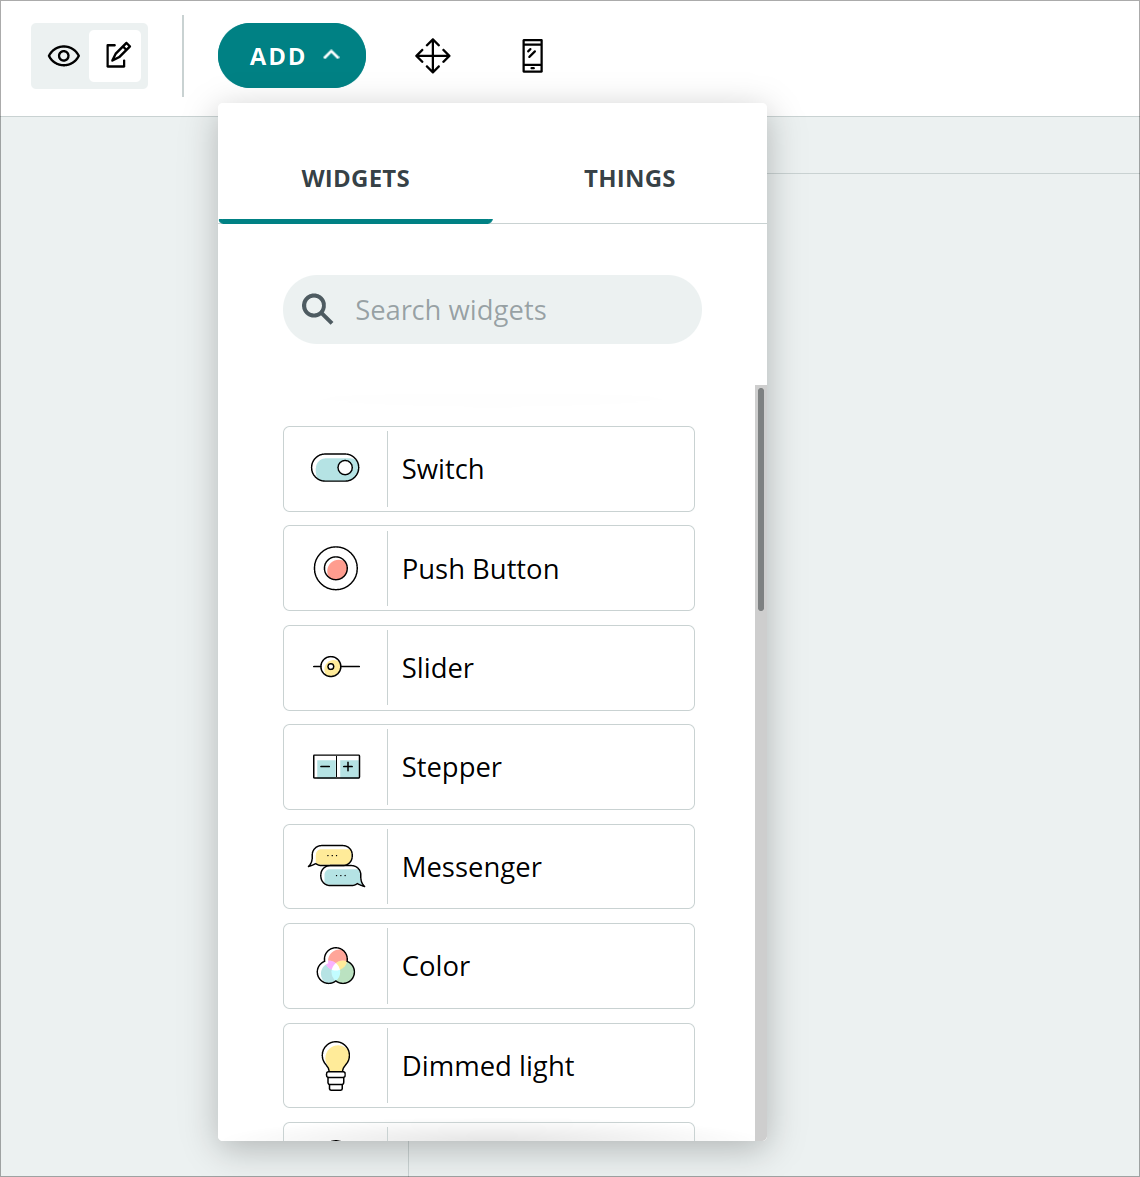
Building a dashboard is just repeating the basic edit steps:
- Select a component from the dropdown list,
- A wizard will open to help select the variable of interest and any customisations,
- Once added to the page, change the edit mode into 'move',
- Reposition and resize the elements on the grid,
- Optionally change the mode to 'mobile' and tweak a narrow layout for phone use.
- Once done, return to viewer mode to use the dashboard.
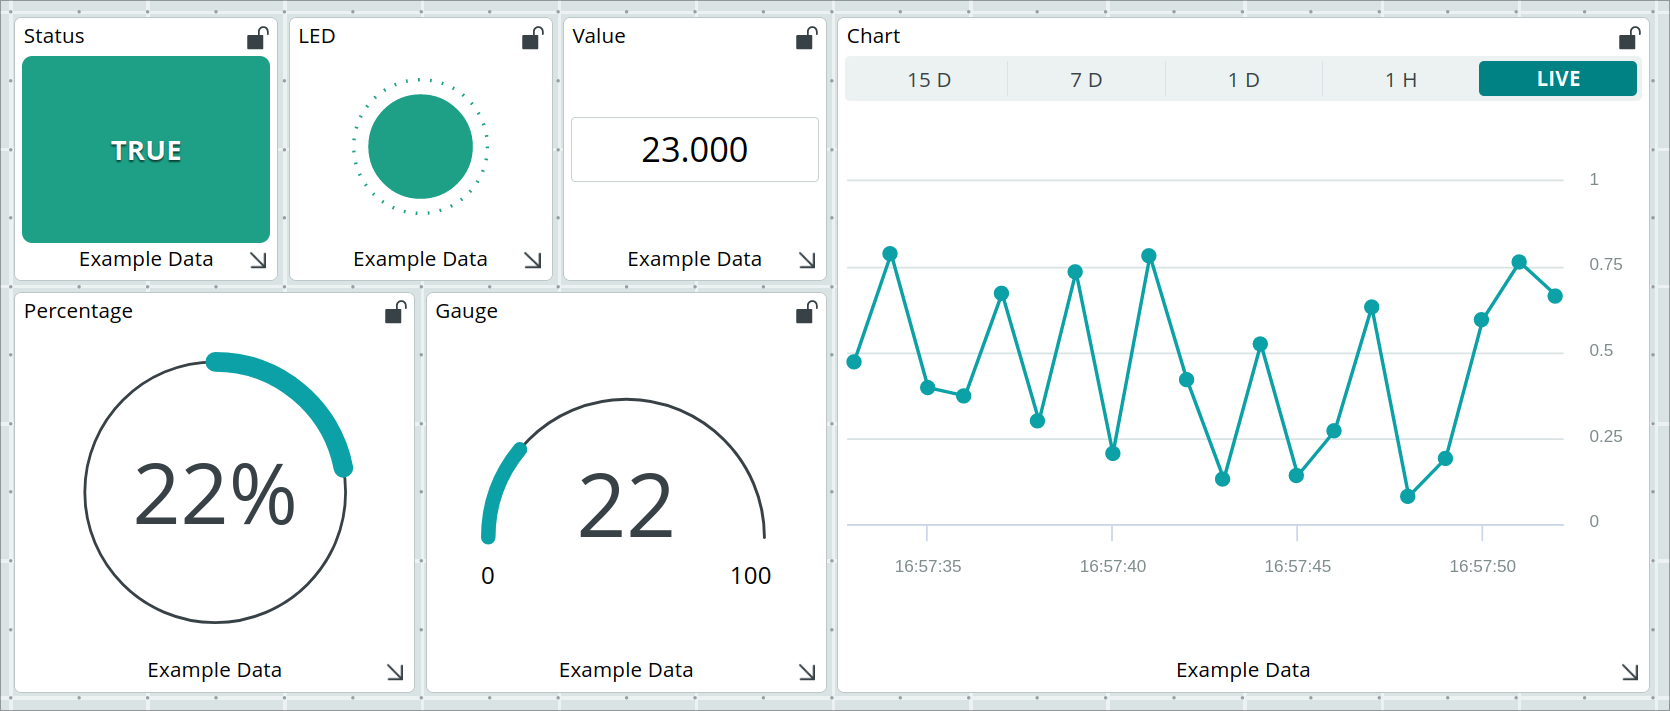
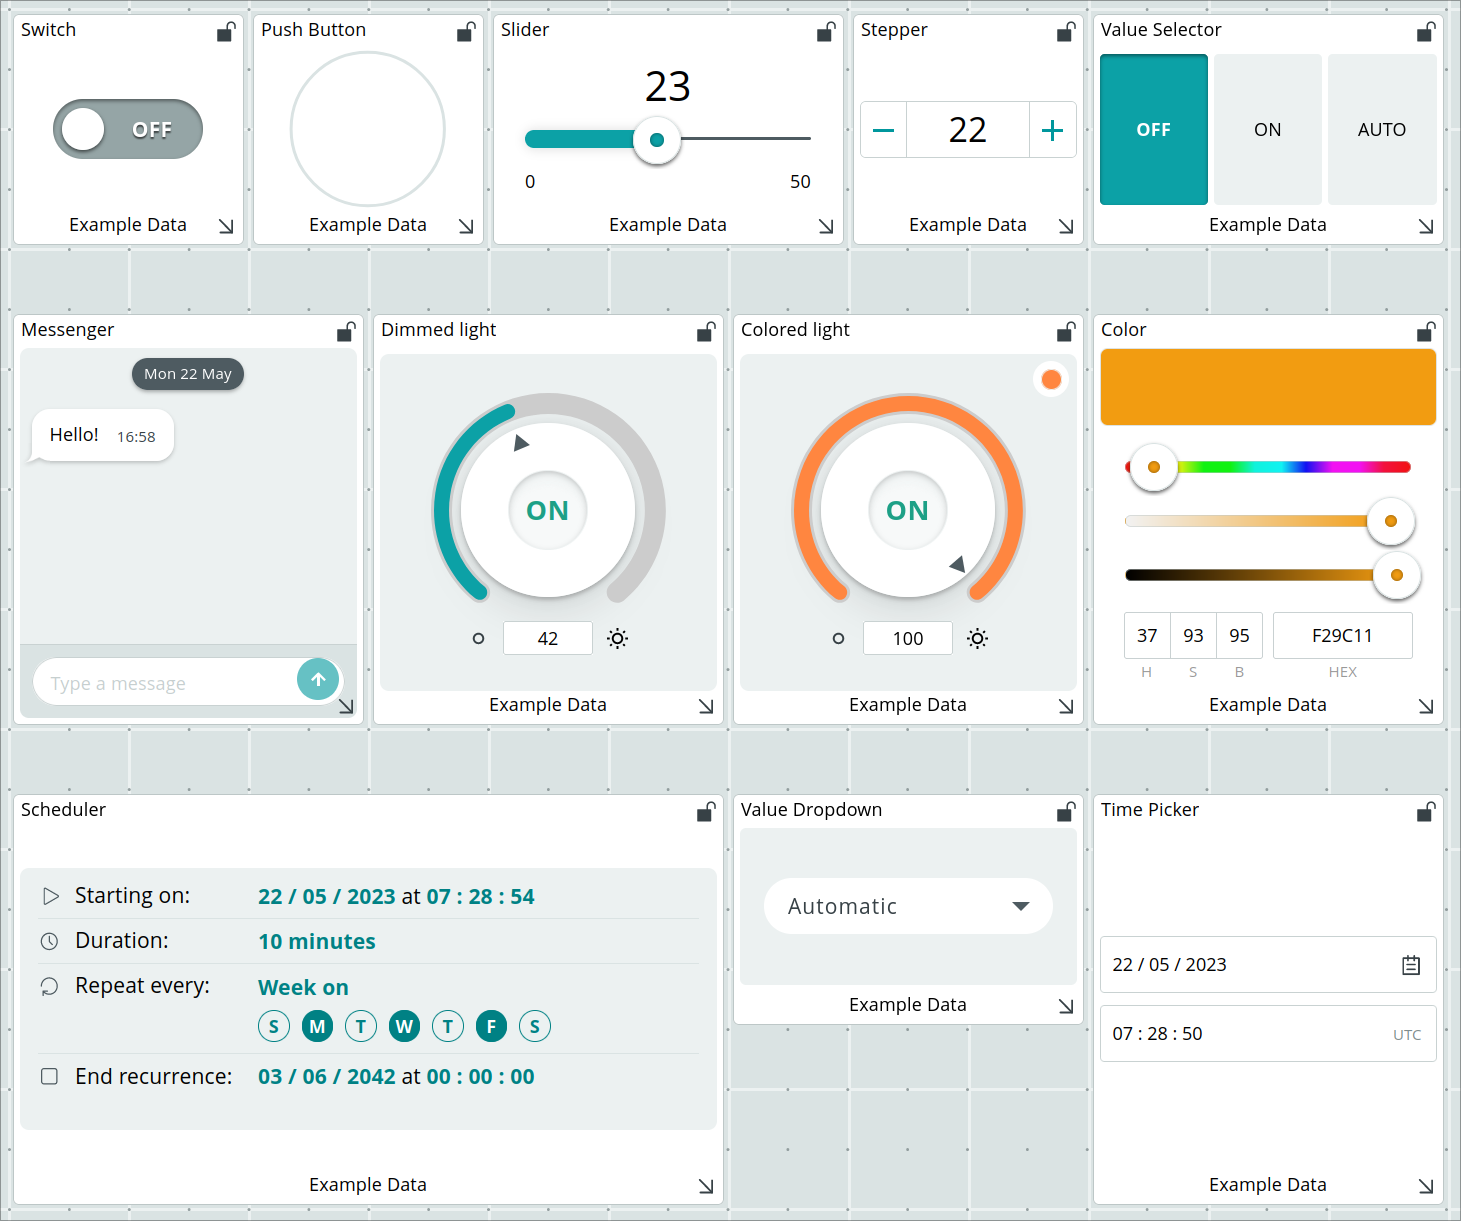
The component library is reasonably strong and well developed, with a good mix of visualisation and manipulation behaviours. Examples for all available components are below:
Mobile Apps
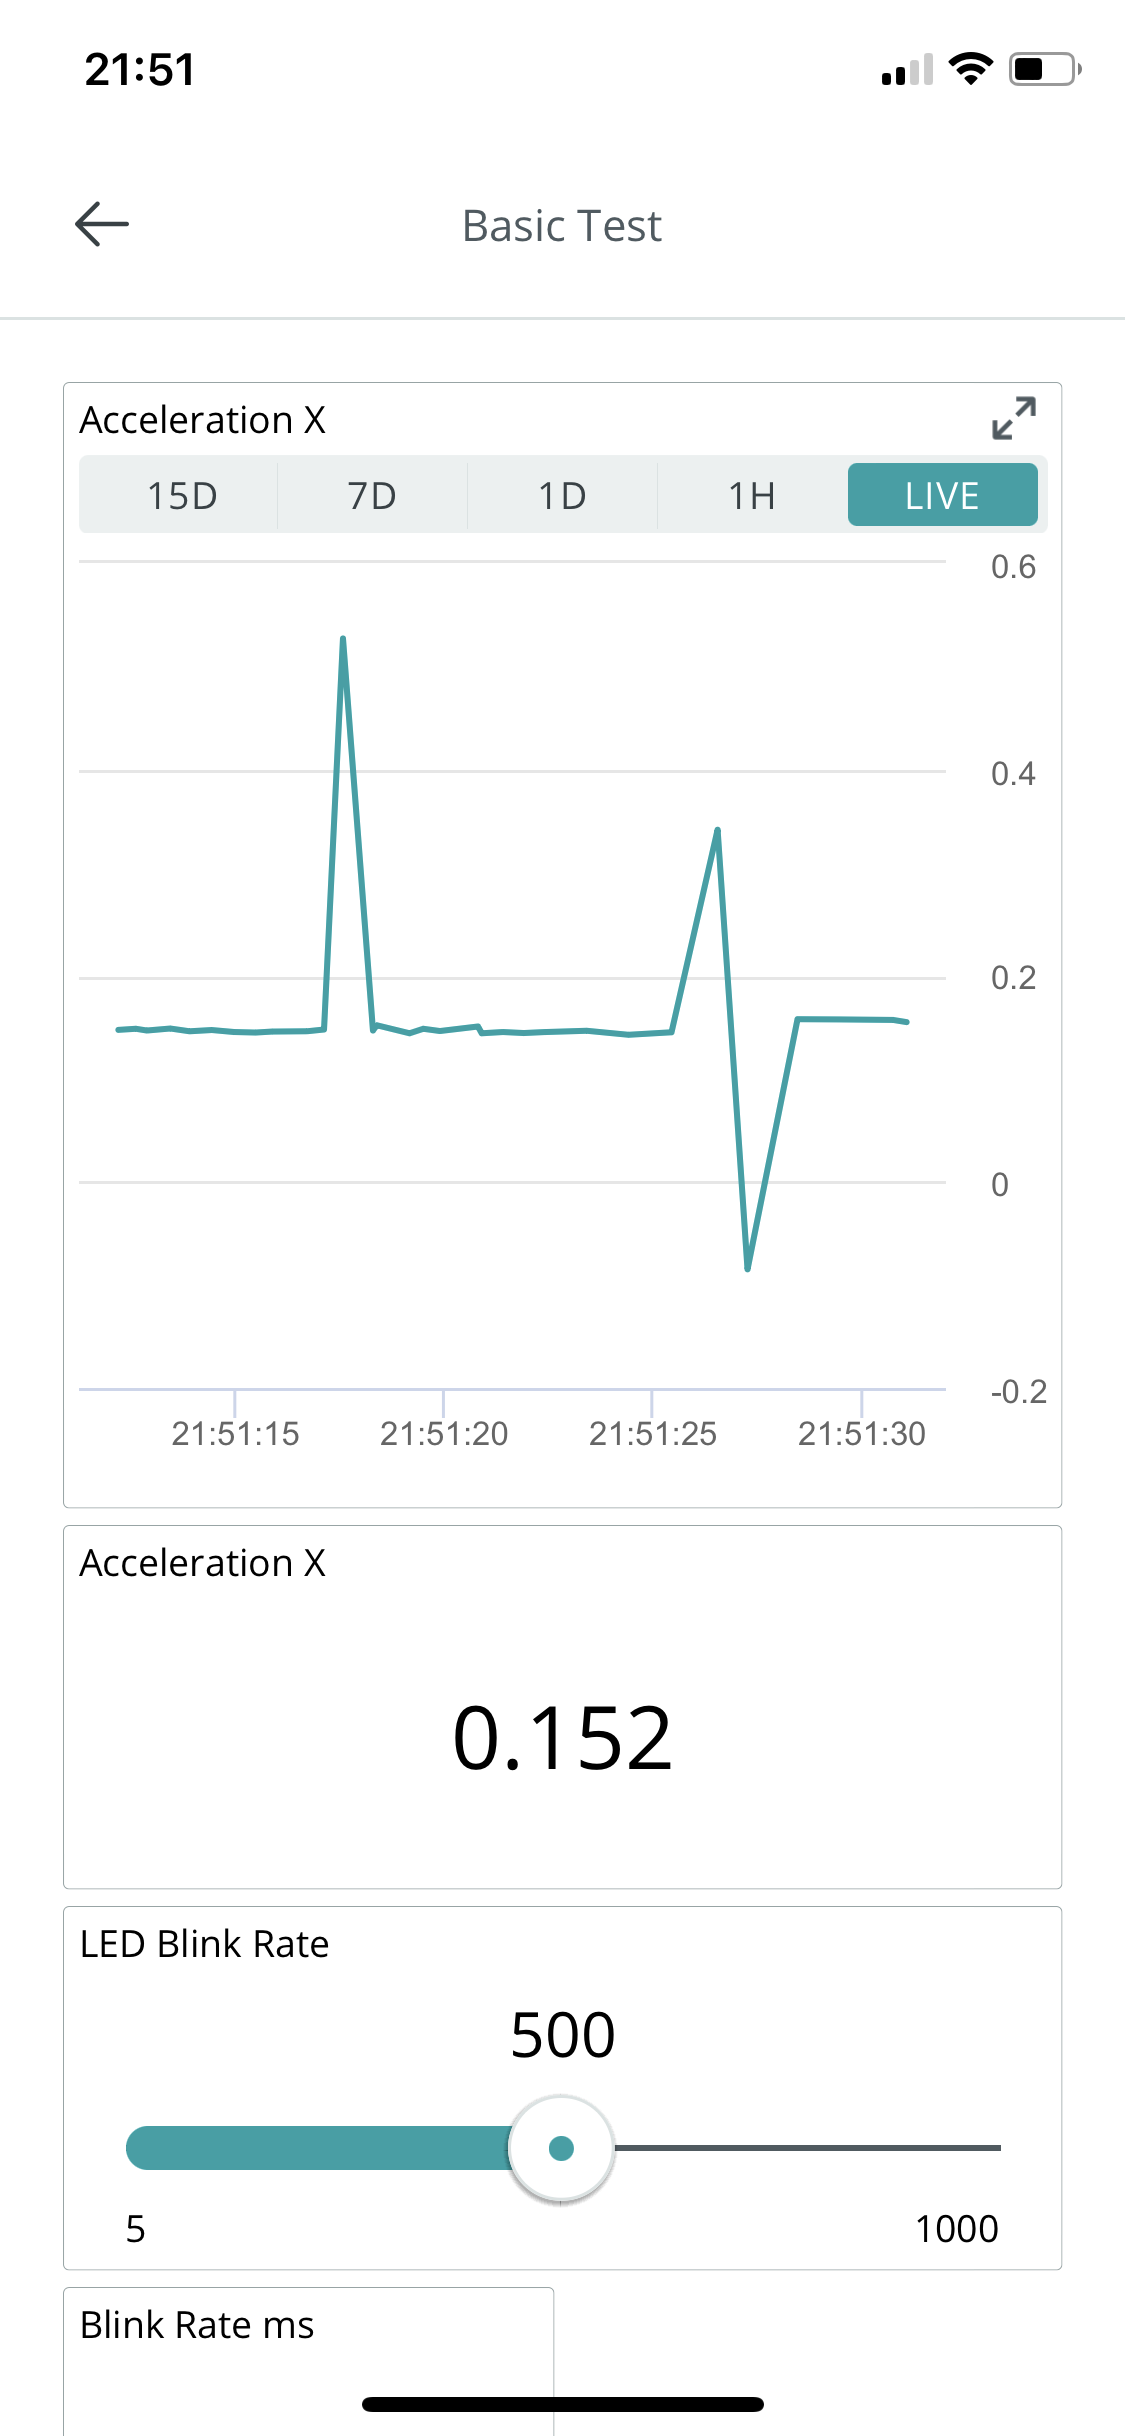
The app acts as a wrapper for viewing the web dashboard. There's a minimal onboarding flow before it requests login details and presents the dashboards as tiles.
The mobile apps cannot modify the layout or component settings.
The tile artwork is slightly customisable, but seems to be local to the app, as the web interface only displays dashboards in a list.
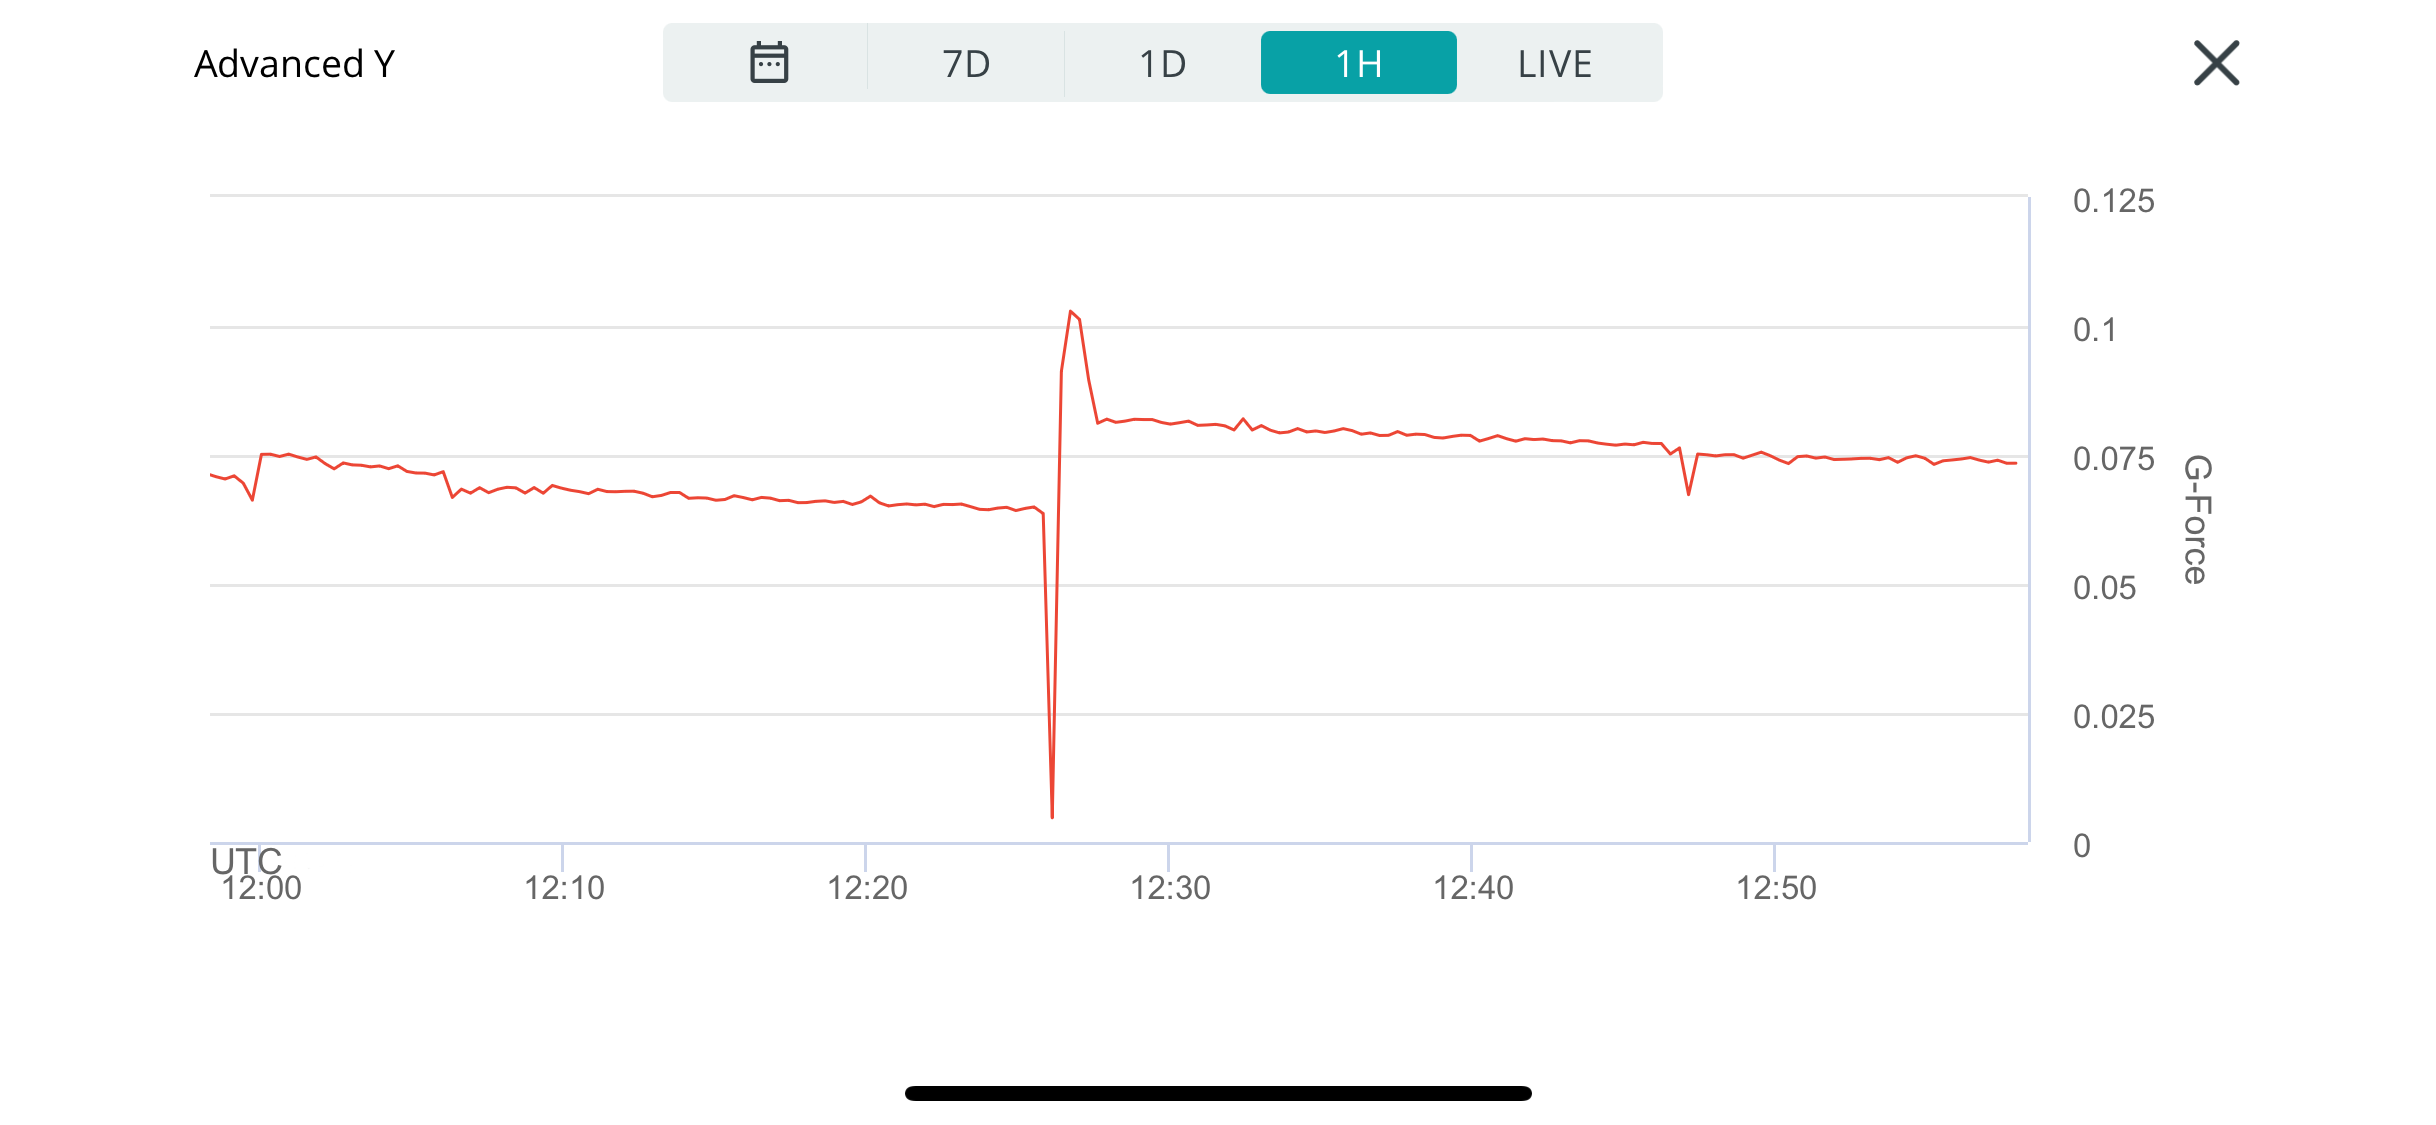
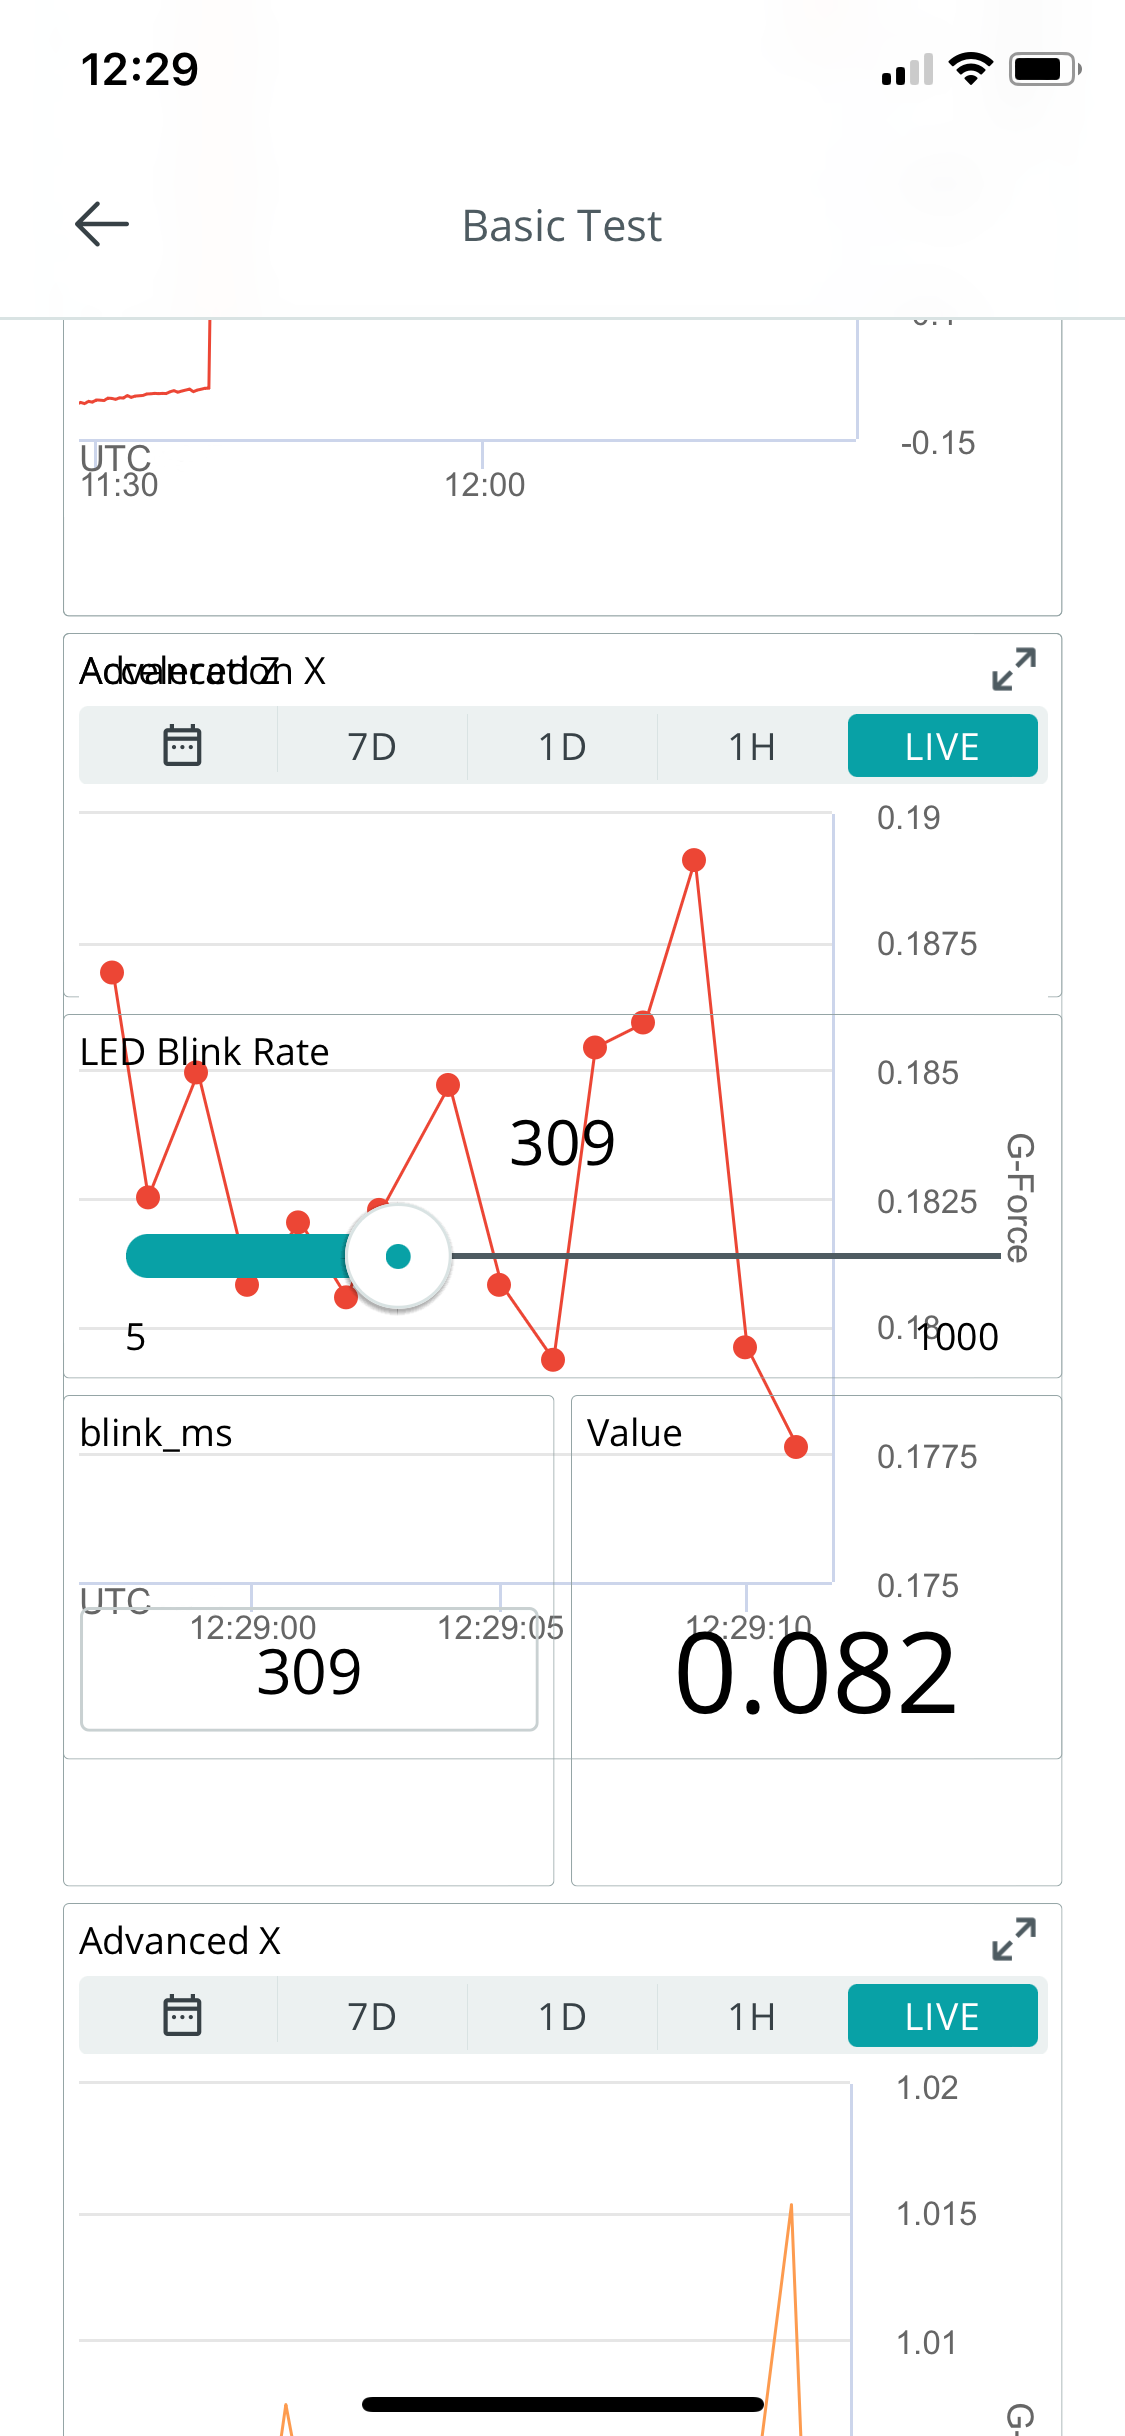
The viewing experience is mostly the same, but charts allow for pinch zooming.
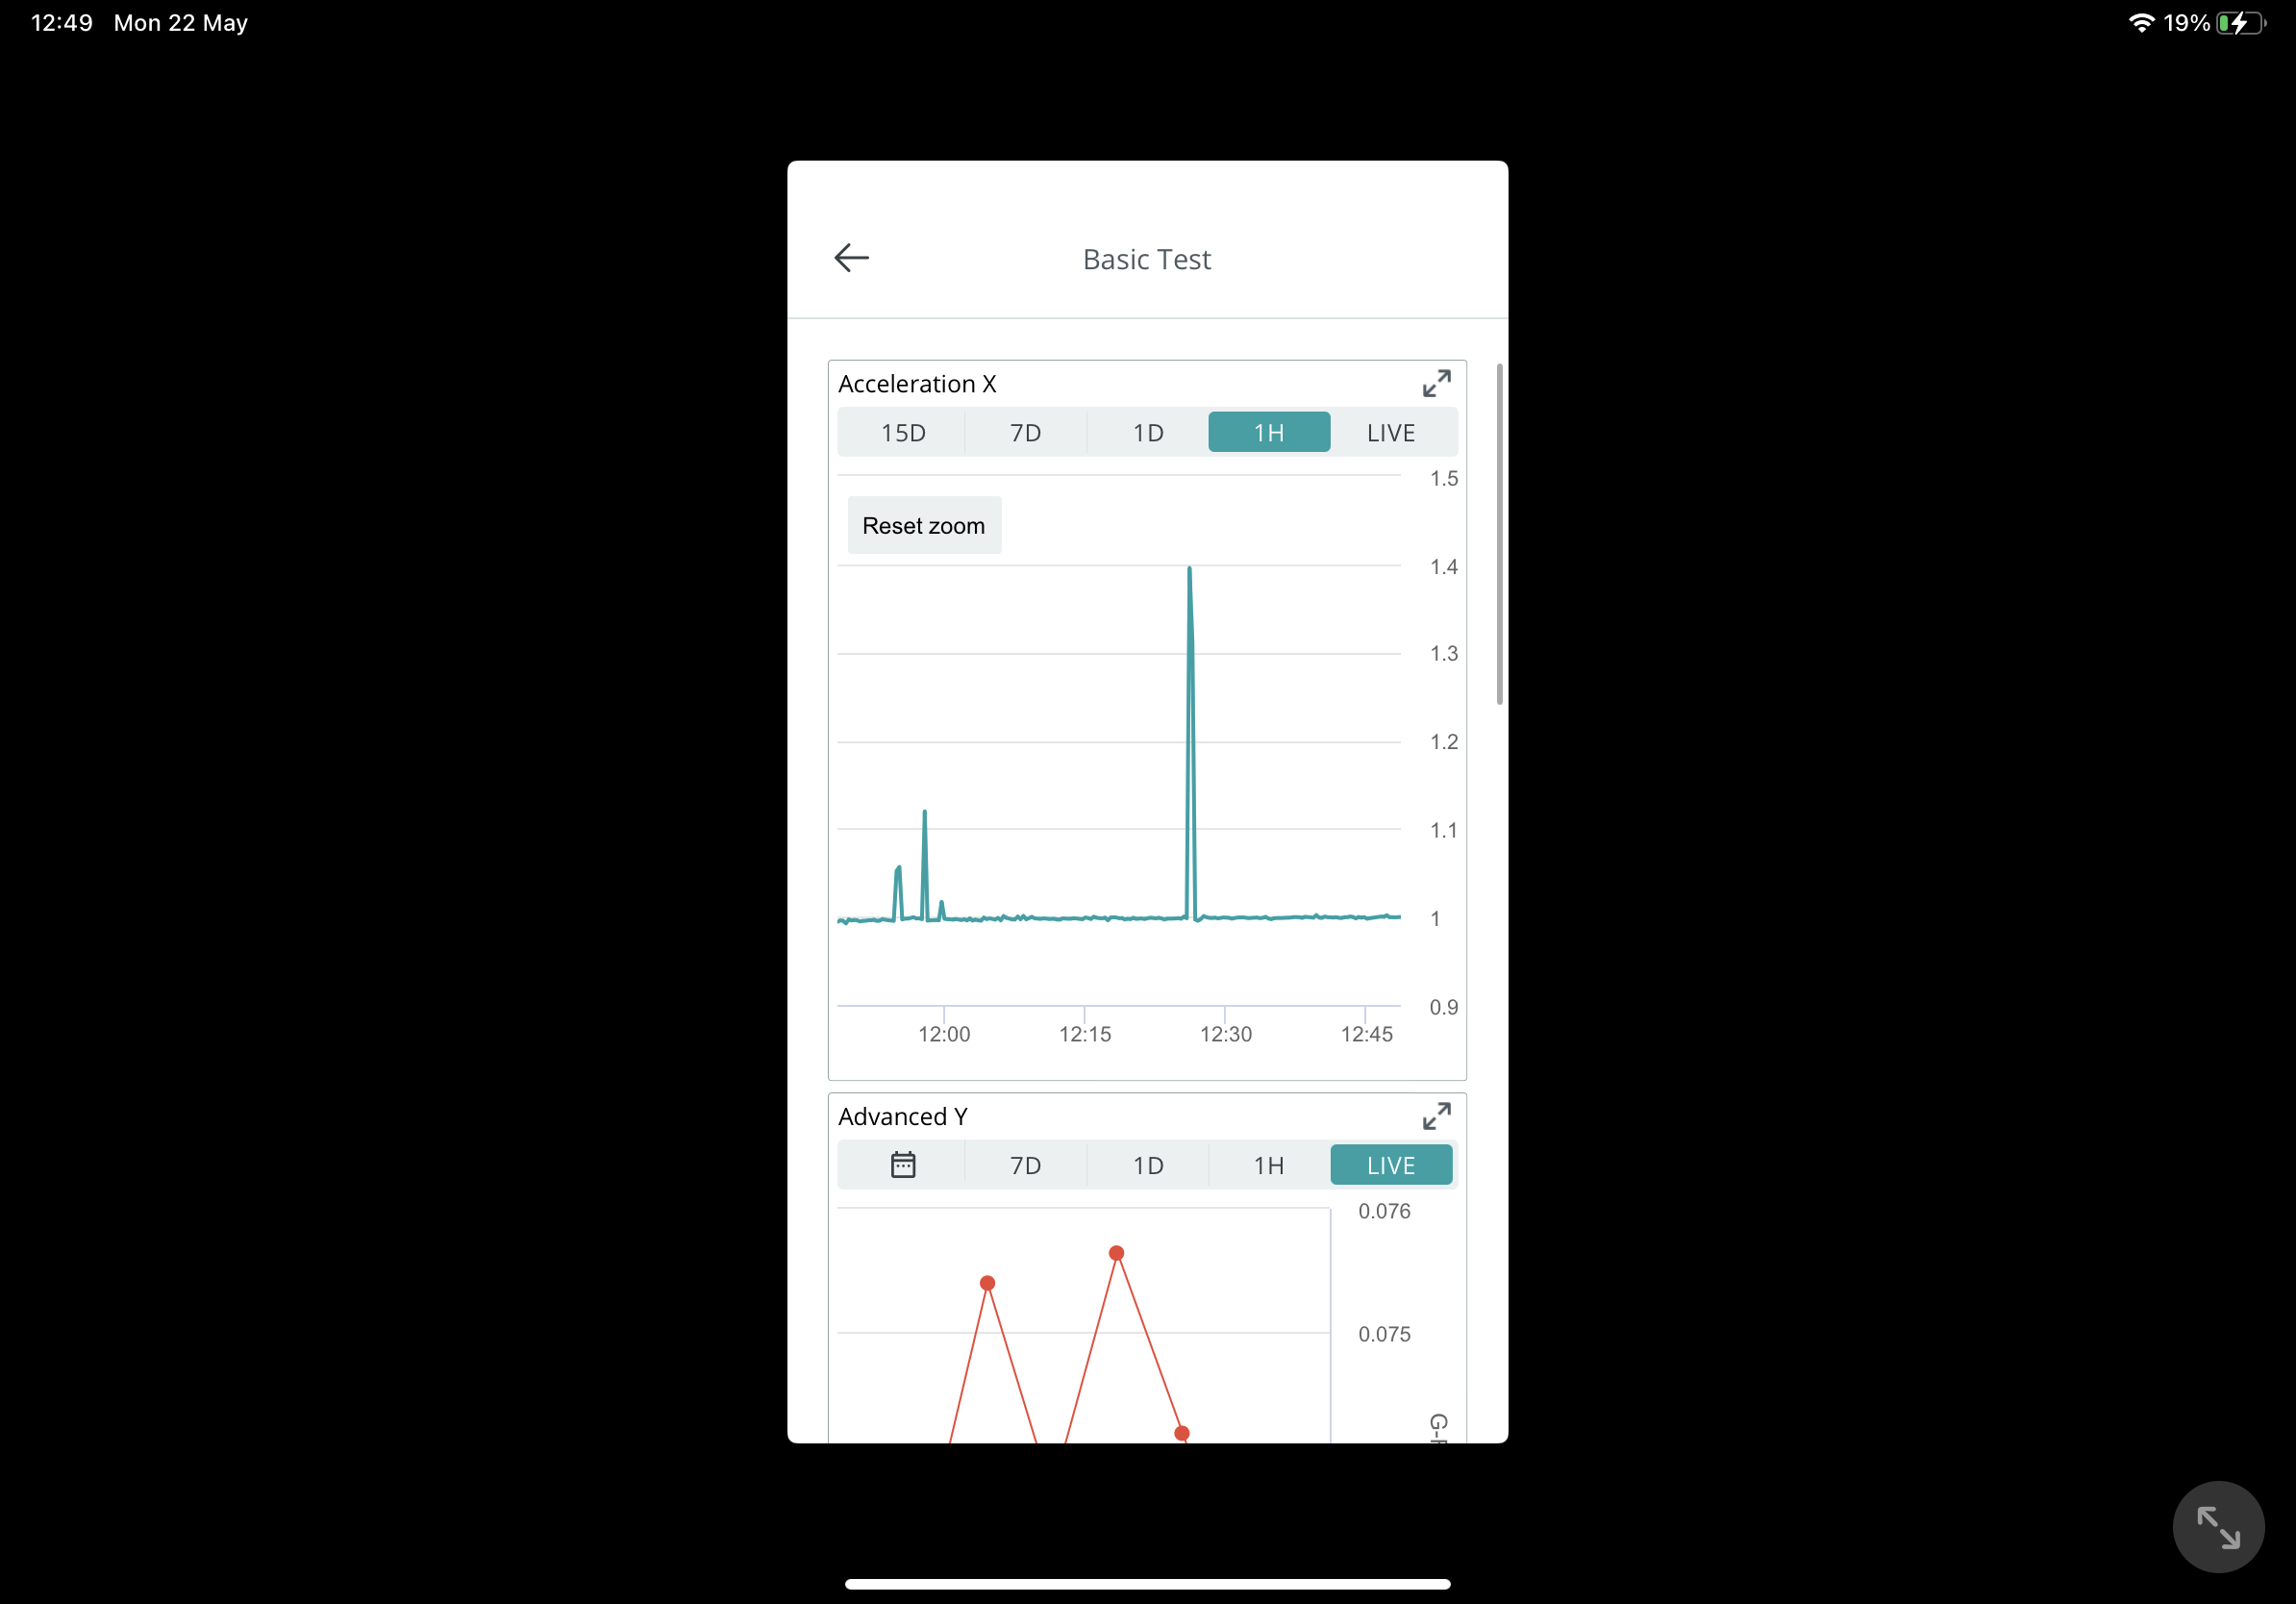
The iOS app doesn't support landscape viewing of dashboards. When a chart is shown full-screen, it forces a landscape view (with plenty of padding).
There is no iPad support for the app, it runs the fallback iPhone layout.
Collaboration and sharing
The ability to share a dashboard via URL to another Arduino Cloud user is a nice-to-have in educational settings or sharing a simple dashboard with family members.
I have not experimented with the collaboration features, but can appreciate the potential educational use-cases.
I'd like to see the ability to share dashboards via URL without requiring an Arduino Cloud account to view them.
Restrictions
While the Arduino IOT dashboard builder is easy to use, and the hardware integration is very easy for supported devices, the tradeoff is a lack of customisation and restricted 'IOT' features compared to other options.
Hardware support
One key consideration is the ecosystem lock-in:
the
ArduinoIoTCloudlibrary is the only documented path for interacting with the Arduino IOT infrastructure,The officially supported hardware is a relatively small list of WiFi, LoRA or GSM enabled boards.
MKR 1000 WiFi
MKR WiFi 1010
Nano RP2040 Connect
Nano 33 IoT
GIGA R1 WiFi
Portenta H7
Portenta H7 Lite Connected
Nicla Vision
MKR WAN 1300
MKR WAN 1310
MKR GSM 1400
MKR NB 1500
ESP32
ESP8266
While it's possible that 3rd party boards based on these platforms may work, the tight level of integration makes the library fragile.
If any changes are required then modifications to the Arduino_ConnectionHandler library may be needed. I found this out trying to get the library working with the ESP32 MicroMod from Sparkfun..
Charting Decimation
Decimation is the process of reducing the amount of data points presented in the chart. This is normally done to improve performance, save bandwidth, or make a signal easier to understand.
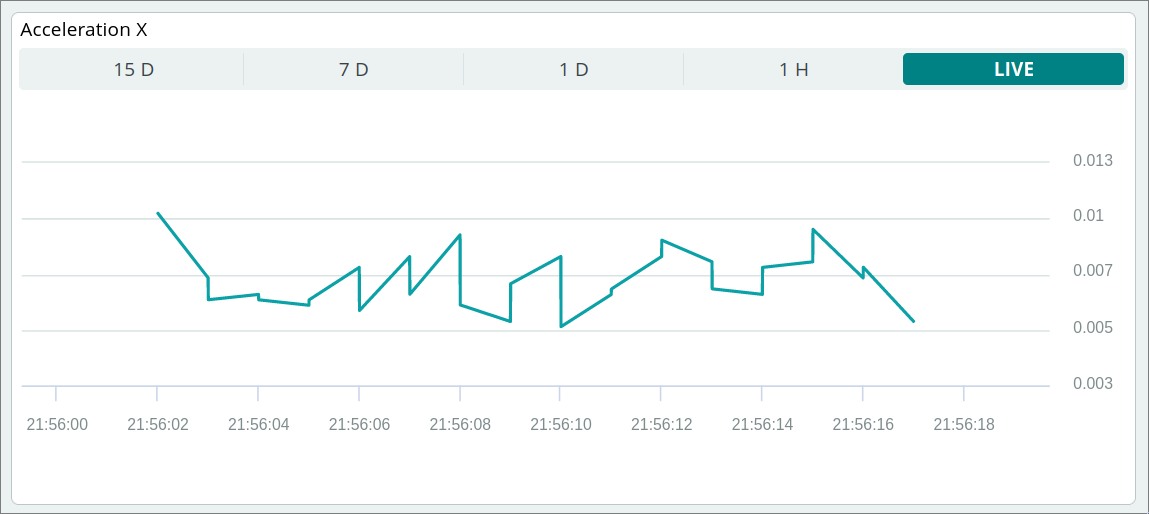
When charting data pulled from the Arduino IOT storage backend, automatic time decimation is applied, even when manually zooming into a shorter time period.
| Historical Span | Accessible Update Rate |
|---|---|
| Realtime | ~1 second |
| 1 hour | ~5 seconds |
| 1 day | ~1-7 minutes |
| 7 day | 10+ minutes |
| 15 day | 22 minutes? |
This behaviour is understandable in the context of keeping the database queries manageable, but is unconfigurable and hinders the usefulness of retaining data over any longer timespans.
Advanced Charts
To plot more than one line on a chart with the advanced charting UI component, a subscription to the Maker tier is required.
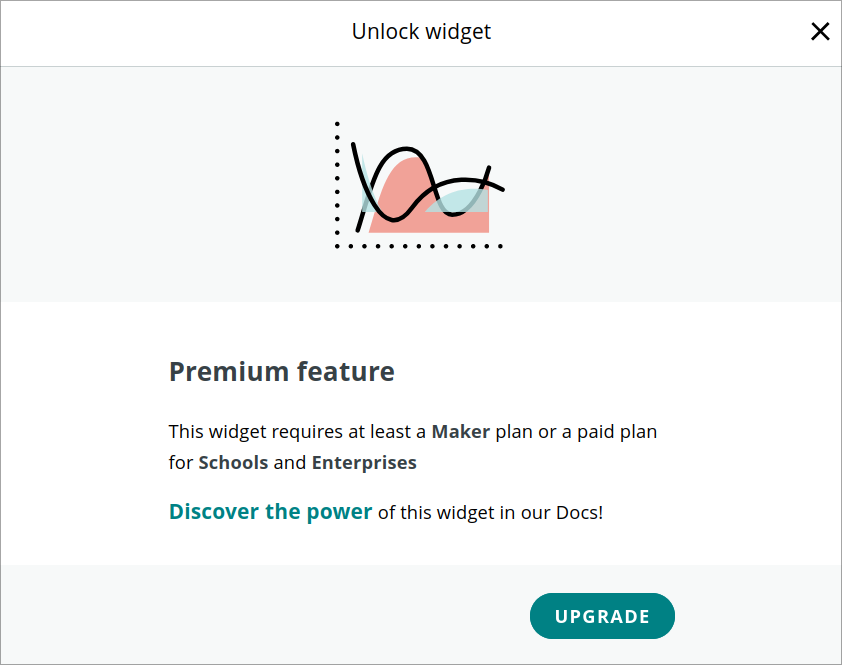
This unlocks the ability to draw up to 5 variables on chart, the addition of 'shaded area' lines and bar-charts, and allows you to select the colour of each line. A scatterplot without the connecting lines is not available.
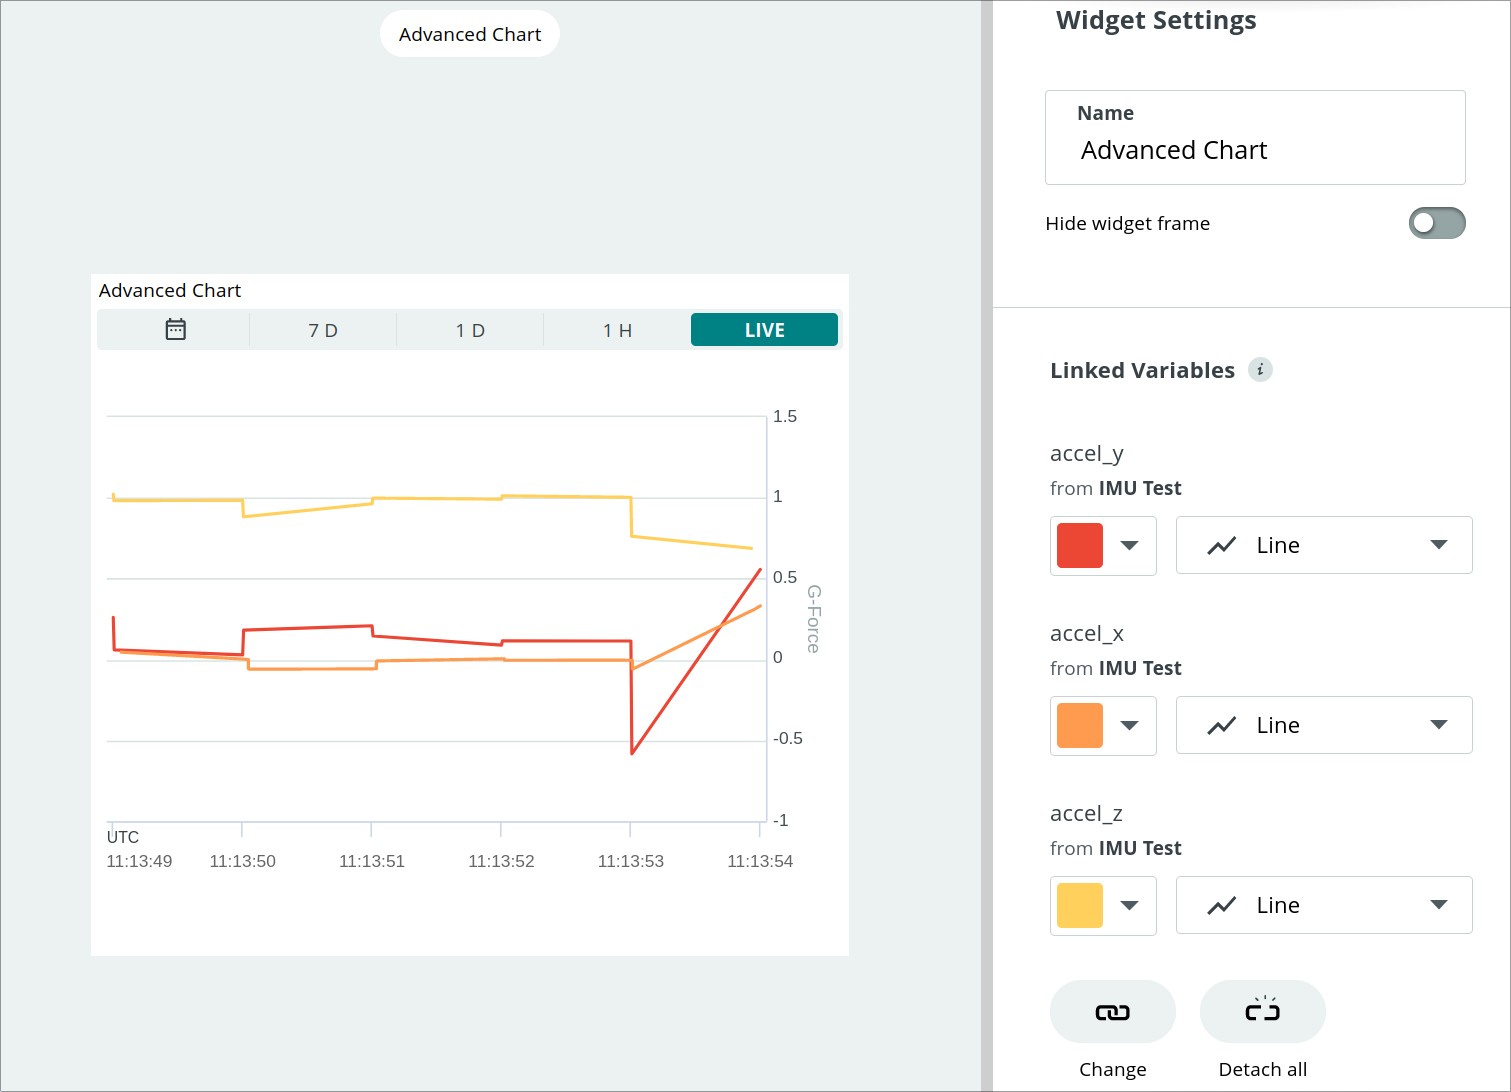
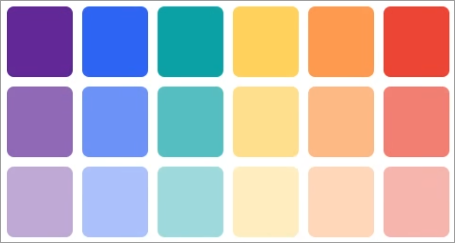
Color selection is rather limited to 6 options with 3 levels of 'lightness' each. The Arduino brand 'teal' is the closest choice to green unfortunately.
There is also no ability to:
- Customise line thickness,
- Move the y axis to the left side,
- Format the timestamp axis for readability, or 'snap' to a more readable seconds interval,
- Enable/disable auto-scaling for the y-axis, or set manual limits.
- Hide the 'timezone' text displayed on the left side of the 'time' axis.
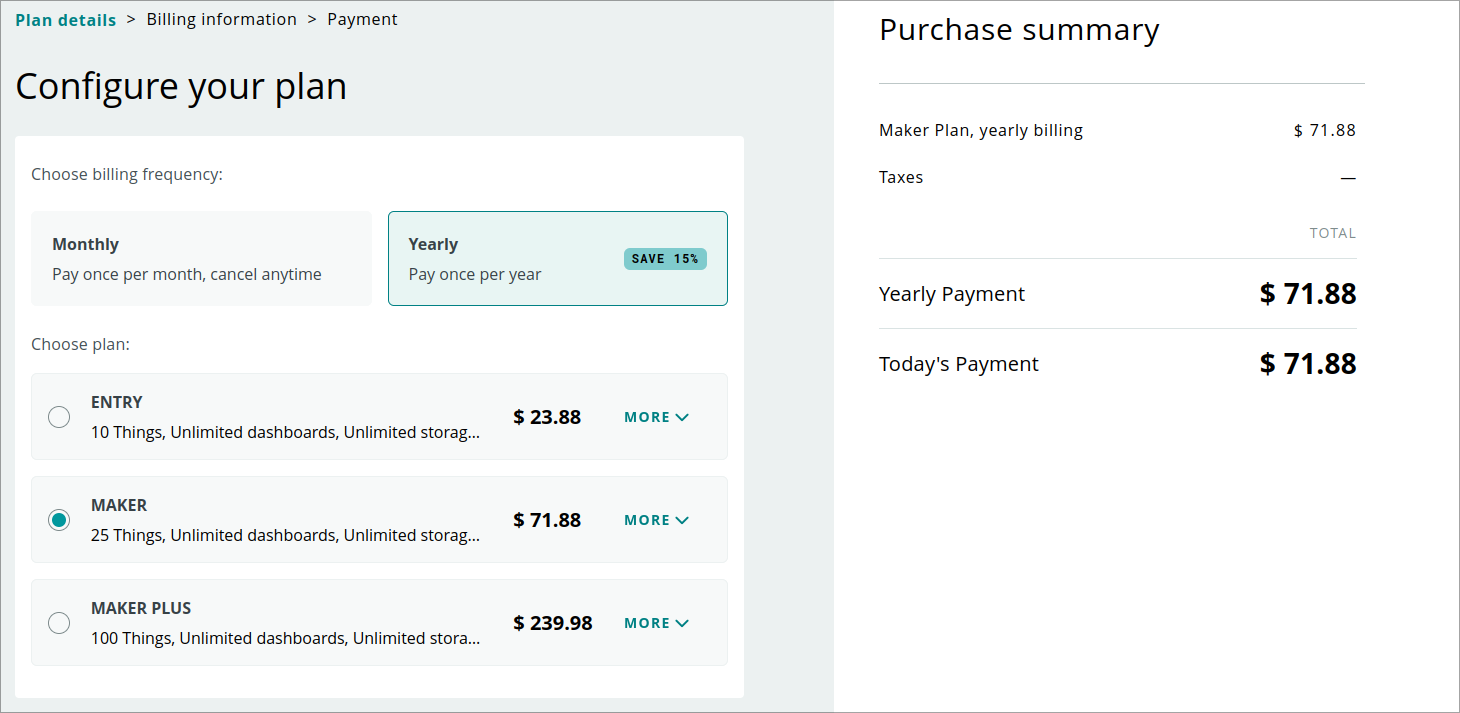
Data Retention
- The free tier only retains one day of data (which feels reasonable for basic use).
- Upgrading to a higher tier plan does not make any older data available.
- The increase in cost from the 90 day retention limit for the 7/month Maker tier, to 1 year retention at 20/month represents poor value.
Actually using the retained data in a dashboard is difficult due to the decimation on charts and inability to build custom components or queries.
- Perform analysis/statistics on on-device and send results to the cloud, or
- export the historical data and use a separate tool...
Exporting data
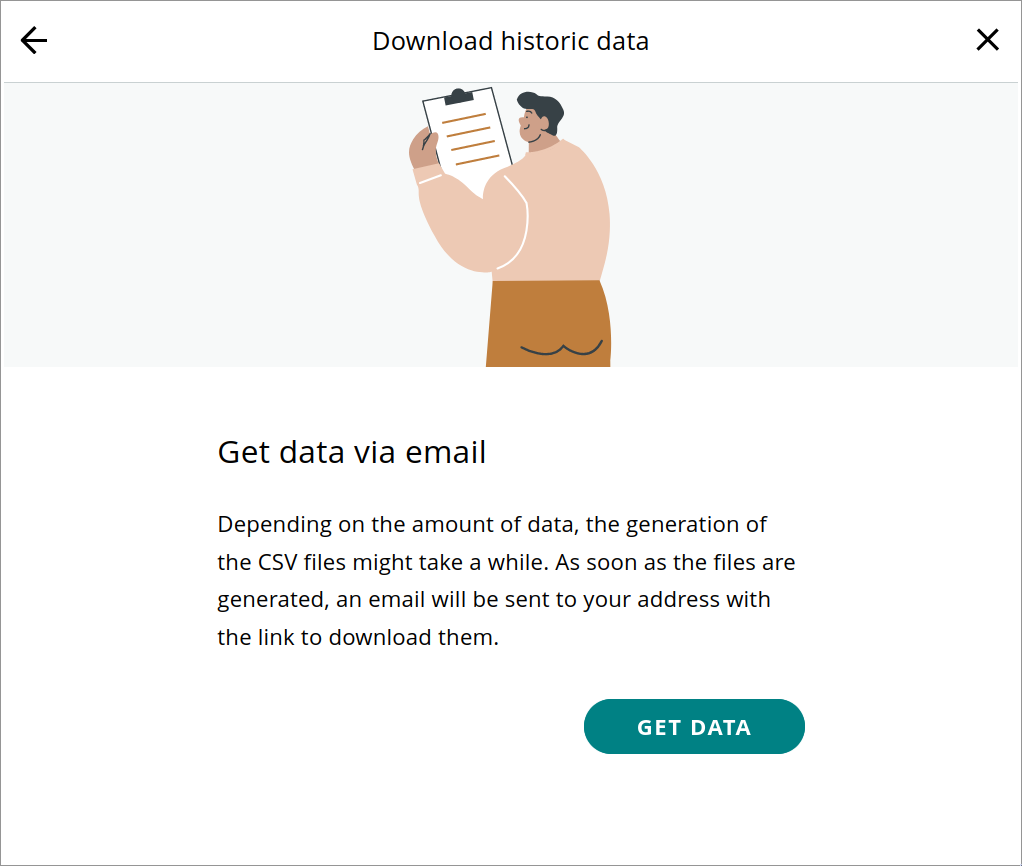
There's no direct 'log to CSV' capability or component intended for easy export. A tedious 'historic data' request process does exist though, with some major drawbacks if you aren't expecting them.
Quirks/issues with the export implementation are numerous:
The export doesn't allow you to include values that aren't used in a dashboard in a specific manner?
- Adding a chart or advanced chart with variables did not mark those variables as available for download...
- Adding a new text 'value' readout of the variable did mark the variable as available for download.
- Thankfully, an export of an 'unmarked' variable includes historic data, not just from the time of adding the readout.
The download process requires you to request an email link for the download first, making the export process a far from convenient
The download is a zip containing a sidecar text file describing the other files, and separate CSV files for each value selected for download.
Arduino IoT Cloud historic data

variables:
  - id: 05cb82f5-[...]
    name: accel_x
    thingName: IMU Test
  - id: bc11d2fe-[...]
    name: blink_ms
    thingName: IMU Test
from: 2023-04-08T00:00:00Z
to: 2023-04-22T23:59:59Z

Have fun! :)
CSV files only include timestamps and value columns, titled
timeandvalue.time value 2023-04-20T11:48:32.39Z 0.0736880004405975 2023-04-20T11:48:32.895Z 0.0744199976325035 2023-04-20T11:48:33.395Z 0.0736880004405975 2023-04-20T11:48:33.894Z 0.07710400223732 2023-04-20T11:48:34.396Z 0.0746639966964722
The execution of the export functionality is disappointing due to the missed opportunity to make it useful
- the
accel_xvariable was configured as aCloudAccelerationtyped variable, which describes it as a rate inm/sec². - The CSV column title could easily include the variable name, measurement units, etc.
- While it's understandable that combining multiple signals in one file can be tricky due to different timestamps, an option to export an aliased/polled file with all relevant signals would make it far easier for use elsewhere. For a dashboard product to use drag & drop interactions as the only layout tool, it has annoying layout shift bugs. For example, dragging a component over others will trigger a re-layout to create room without any delay or confirmation.
Issues & Bugs
This section describes incorrect design decisions, bugs and general complaints with the core functionality of the software.
Editor layout shift
For a dashboard product to use drag & drop interactions as the only layout tool, it has annoying layout shift bugs. For example, dragging a component over others will trigger a re-layout to create room without any delay or confirmation.
The handling issues are exacerbated by quick auto-scroll behaviour. There's also no easy way to 'undo' the resulting layout shift!
The 'lock' toggle is visible on each component and can reduce the frustration for 'finished' sections of a layout, but honestly, locking and unlocking components frequently isn't a viable solution to a poorly behaving drag implementation.
Lack of grid sizing controls
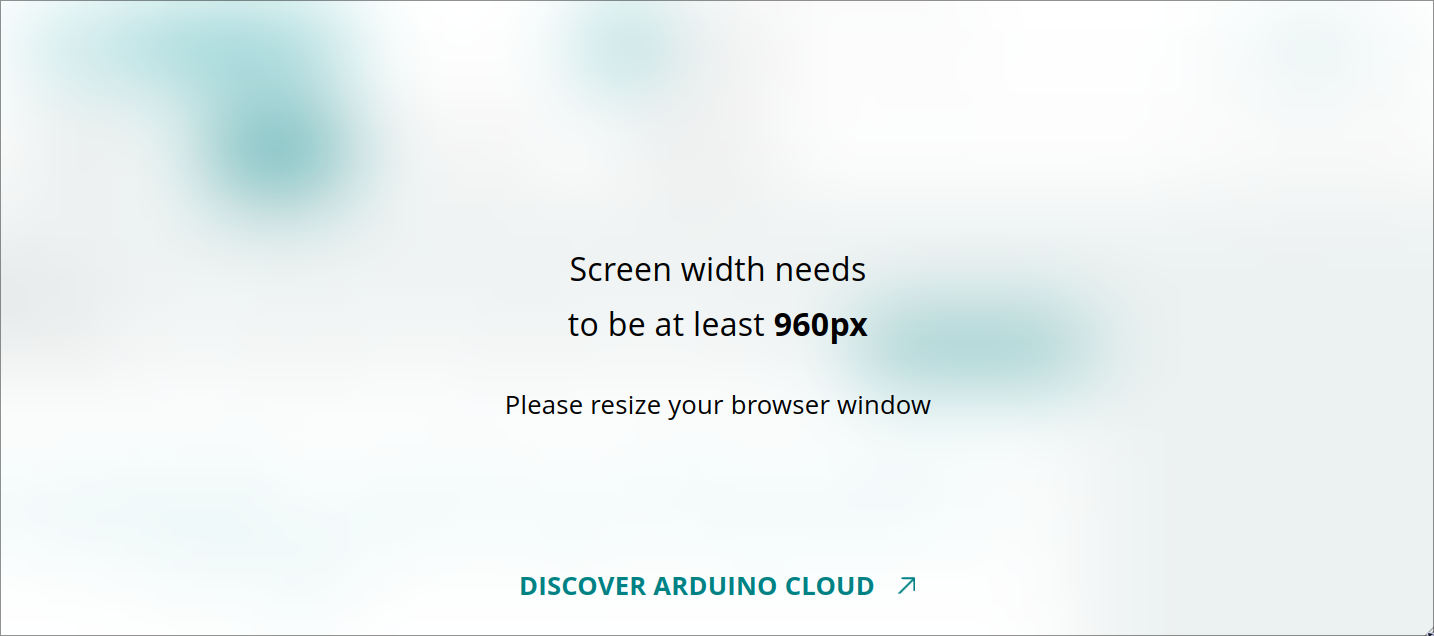
The 'layout grid' area for the dashboard is not horizontally resizable and is fixed to 960px. While this width makes sense for blog content and social media feed layouts, a dashboard should provide the ability to use as much screen as possible and prevent vertical scrolling.
There's no pagination inside a dashboard, forcing a tradeoff between one dashboard or leaving and loading another one for different layouts.
Annoyingly, the web interface complains when the browser is narrower than 960px. This feels like a poor excuse for handling responsiveness, especially given the availability of a separate 'mobile' layout.
Components missing polish
- The slider component allows you to 'jump' to a value without grabbing the handle, but the interaction area is the same 4 pixel area as the slider's rail.
- The chart would often exhibit a display bug where the sides of the plotted line wouldn't extend to the edges of the axis frame.
- In several different situations, the
Steppercomponent which displays a number with + and - buttons, would stop displaying the value edit buttons entirely.- The only way to restore the buttons was removing and re-adding the component.
- There is no ability to render units or descriptions on components, and there's no UI facing 'label' component to fill in.
- The sticky-note with markdown integration is a nice touch but doesn't solve the underlying issue.
Mobile app layout issues
I encountered intermittent layout bugs with the iOS app.
Charting Issues
The decimation applied to charting applies based on the timespan selected.
Manually zooming only presents a subset of data that was queried as part of the selected timespan.
For a IOT dashboard product with a storage backend, manually selecting a window of data should query for higher resolution data.
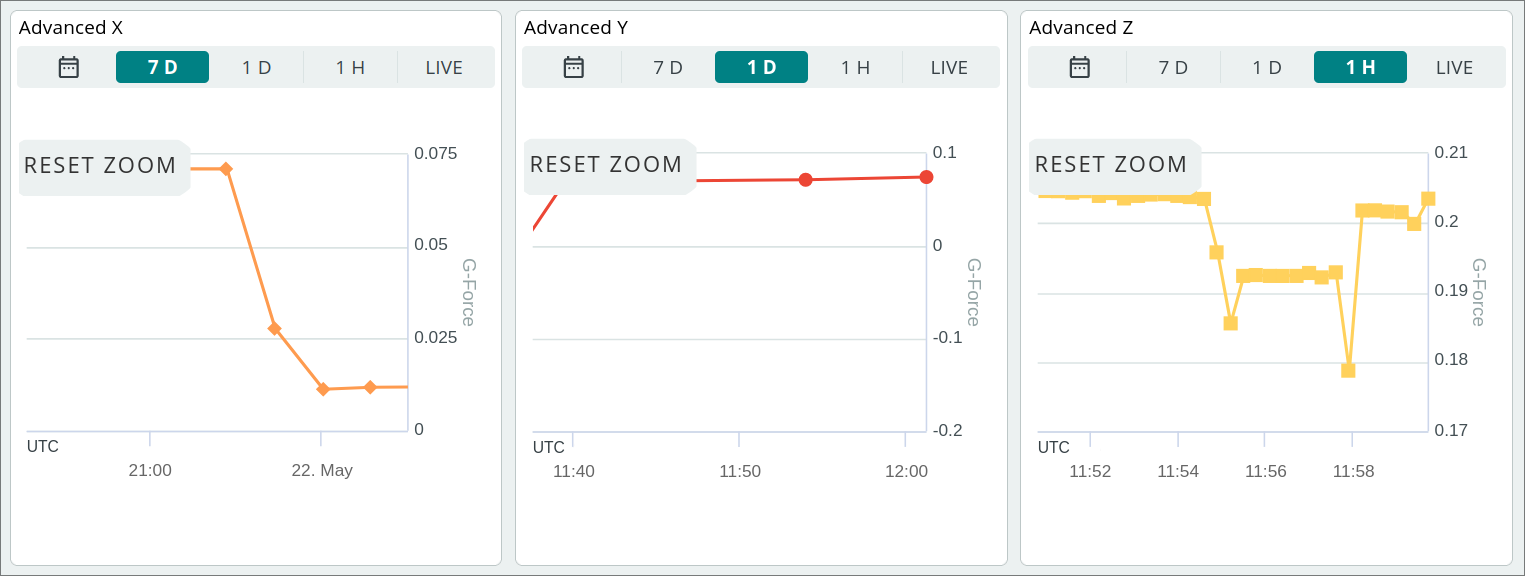
Additionally, the "RESET ZOOM" button is huge and occludes the chart.
No Undo/Redo or versions
Once you've established a dashboard layout, the tooling doesn't promote enhancement or bulk modification. This is made worse by layout shift behaviour and other bugs mentioned above.
The simple ability to undo or restore the most recent change would improve the UI builder experience substantially, and ideally some kind of version history to encourage experimentation.
Duplicating and renaming old dashboards to achieve a 'save' isn't adequate due to poor UI, clutter of the dashboard layout page, and consumption of your dashboard quota.
Pricing
Perception and tolerance of the pricing model is going to be subjective, but my key thoughts are as follows:
The free tier is mostly fair, though the artificial restrictions could be tweaked.
I don't think the advanced charting component provides commensurate value to be gated behind the paid Maker tier.
I find it confusing that the machine-learning functionality has the same allowances regardless of subscription plan?
Recommendations
In general, I think the IOT and dashboard functionality achieves it's intended purpose - act as a educational tool and pathway for new Arduino users.
The website and documentation are high quality, example projects are well thought out and produced, and the general functionality is fine for simple use-cases but will leave ambitious users wanting for more.
The obvious audience targeted by the Arduino Cloud platform is Chromebook based schools where the cloud IDE and compile tooling present actual value, and collaboration tools and project templates make group activities easier.
As you shift away from this target market, less of the Arduino Cloud platform will apply to your needs.
Beginner/Educational Users
5 variables and 2 devices is enough to create a simple remote-control system or visualise a few simple sensors, and the low-code interface will let you build a interface really quickly - assuming you're already using a compatible Arduino.
If you're planning on using the free personal-use tier for cloud compiles (25 per day), you'll probably hit the limit. Consider running the Arduino IDE on your own computer if possible.
Serious Users
If your project needs:
- lower latency input controls,
- theming or any visual customisations,
- the ability to visualise larger numbers of signals at once, or view updates faster than once a second,
- controls over data retention behaviour,
- or you want to export or view log files frequently,
Then you'll either have to compromise on functionality or choose another option which provides more control over the UI experience.
If you're tied into the Arduino ecosystem already and willing to pay ~$7/month for Maker, it's not the worst choice for short term projects as the value of low-effort OTA update functionality and cloud editor/compilation functionality might be useful for rapid prototyping.
Professional users
Arduino Cloud IOT is not a platform you can/should build a product on, though there are some niche areas where partial integration might make sense:
- If your product is for the STEAM/educational market and customers interact with it as Arduino users,
- A sensible 'integration' can be made using the Arduino Cloud API or Webhooks, i.e. a standalone product that integrates as part of an end-user's own Arduino IOT dashboard.
- As an in-house prototyping tool, assuming existing ecosystem buy-in.
Arduino Cloud for business apparently exists but marketing material suggests it's the same dashboard and cloud functionality, with some fleet management tooling, and higher costs. If you're planning on deploying with it, compare it against other options and aggressively test all required functionality first.